


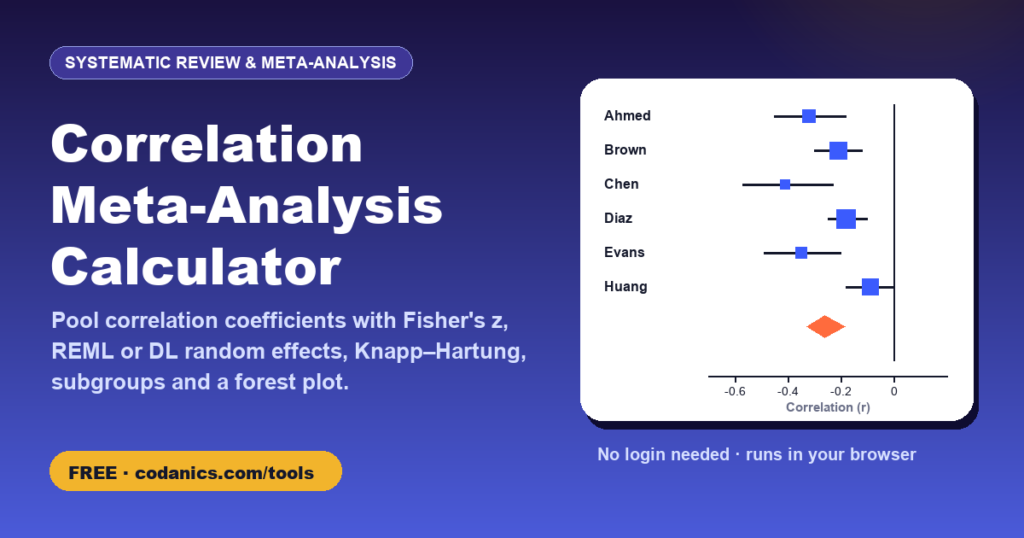
Correlation Meta-Analysis Calculator: Pool r with Fisher's z and a Forest Plot
Pool Pearson correlation coefficients from several studies. Enter r and the sample size for each study and get the pooled correlation with its 95% confidence and prediction intervals, heterogeneity, optional subgroup results and a forest plot. Correlations are pooled on Fisher’s z scale and converted back to r, as most reviews do.
| Study | Correlation r | Sample size n | Subgroup (optional) |
|---|
- PriceFree, no login or sign-up needed
- Your dataProcessed in your browser, never uploaded
- Works onPhone, tablet or computer, any modern browser
- Made byDr. Muhammad Aammar Tufail, Codanics
- Published17 November 2026
- Last updated16 November 2026
📚 How to cite this tool
This tool is free. If it helped your thesis, paper, report or assignment, please cite it. It keeps the tools free and helps other students find them.
Tufail, M. A. (2026). Correlation meta-analysis calculator: pool r with Fisher's z and a forest plot [Online tool]. Codanics. Retrieved 16 November 2026, from https://codanics.com/tools/correlation-meta-analysis-calculator/
In-text citation: (Tufail, 2026) · Narrative: Tufail (2026)
The access date is today’s date, filled in automatically. Author: Muhammad Aammar Tufail. Published 17 November 2026.
How to use the correlation meta-analysis calculator
- Enter one row per study: the correlation coefficient r and the sample size n. Add a subgroup label (for example adolescents vs adults) if you want subgroup results.
- Or paste/upload your extraction sheet and match the columns. Load example shows eight simulated studies.
- Keep Fisher’s z and REML random effects unless you have a reason to change them. With fewer than about 10 studies, consider the Knapp–Hartung option for safer confidence intervals.
- Click Pool correlations to get the pooled r, its 95% CI and prediction interval, I², subgroup results and the forest plot.
- Download the forest plot, copy the results paragraph and download the table as CSV.
What this tool does
Many reviews in psychology, education, ecology and health combine correlation coefficients, for example between screen time and sleep, or between soil organic carbon and yield. The sampling distribution of r is skewed when r is far from 0, so the standard approach (Hedges–Olkin) converts each r to Fisher’s z, pools the z values with inverse-variance weights and converts the pooled value and its CI back to r.
Methods and formulas
All results were checked against R: escalc(measure = "ZCOR", ri, ni), rma(yi, vi, method = "REML") (and DL, FE, test = "knha") and predict(res, transf = transf.ztor) in metafor 5.2. Estimates, CIs, τ², I², Q and p-values agree to at least 6 significant digits.
Worked example
The example pools eight simulated studies of screen time and sleep quality (N = 2,508). With Fisher’s z and REML, the pooled correlation is r = −.23 (95% CI −.30 to −.15), a small negative association, with substantial heterogeneity (I² = 72%) and a prediction interval of −.41 to −.04. Adolescents show a stronger association (r = −.33) than adults (r = −.15), and the subgroup difference is significant (Q = 14.35, df = 1, p < .001).
Frequently asked questions
Why convert r to Fisher's z before pooling?
Because the sampling distribution of r is skewed and its variance depends on r. Fisher’s z is approximately normal with variance 1/(n − 3), so it can be pooled with standard inverse-variance methods. The pooled z and its CI are converted back to r for reporting.
Fixed or random effects for correlations?
Random effects is the usual choice because the true correlation is likely to vary between populations and measures. The fixed-effect model assumes one common correlation.
What is the Knapp–Hartung adjustment?
It widens the confidence interval to reflect uncertainty in τ², using the t distribution. It is recommended when the number of studies is small. Turn it on in the Confidence intervals menu.
Can I pool Spearman correlations?
Many reviews pool Spearman’s rho together with Pearson’s r, or convert rho to r first. Say what you did in your methods and consider a sensitivity analysis.
How is this different from the Hunter–Schmidt method?
Hunter–Schmidt pools raw r weighted by n and can correct for measurement error and range restriction. This tool uses the Hedges–Olkin approach with Fisher’s z, which is the default in metafor and most medical and ecological reviews.
Is my data uploaded?
No. Everything runs in your browser.
Do I need to log in or create an account to use the correlation meta-analysis calculator?
No. There is no login, no sign-up and no email required. Open the page and start using it straight away, for free, on any device.
How do I cite this tool in my thesis or paper?
Use the citation box on this page. In APA 7th edition: Tufail, M. A. (2026). Correlation meta-analysis calculator: pool r with Fisher's z and a forest plot [Online tool]. Codanics. Retrieved [date you used it], from https://codanics.com/tools/correlation-meta-analysis-calculator/. BibTeX, RIS (EndNote, Mendeley, Zotero), MLA, Harvard, Chicago and Vancouver formats are also available.
Free guides and courses from Codanics
More free tools
See all free Codanics tools → · Codanics on YouTube · WhatsApp channel