


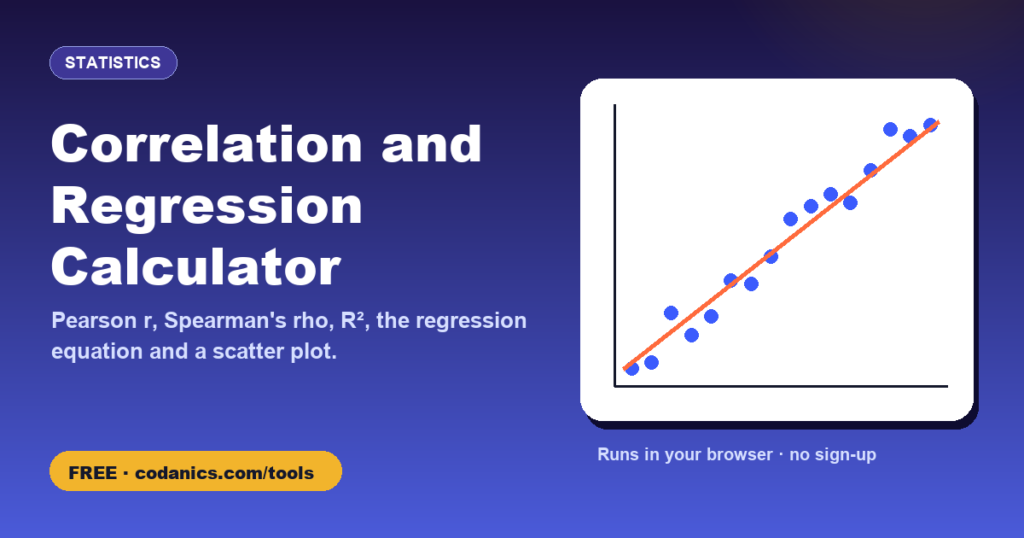
Correlation and Linear Regression Calculator with Scatter Plot
Paste two columns of numbers to see how strongly they move together. You get Pearson’s r, Spearman’s ρ, the regression line, R² and a clean scatter plot for your thesis.
How to use the Correlation and Regression Calculator
- Type or paste your X values in the first box and your Y values in the second, in the same order. Or use Paste from Excel or Upload CSV / Excel and pick the two columns; rows with a missing value are skipped.
- Rename the variables so the sentence and chart labels make sense.
- Click Calculate to get Pearson’s r, Spearman’s ρ, the regression equation, R² and a scatter plot.
- Optionally type an X value to predict Y, with a prediction interval.
- Copy the APA sentence and download the scatter plot.
Pearson or Spearman?
| Pearson r | Spearman ρ | |
|---|---|---|
| Measures | Linear relationship | Monotonic relationship (always up or always down) |
| Data | Two continuous, roughly normal variables | Ordinal data, skewed data or outliers |
| Sensitive to outliers? | Yes, strongly | Much less |
Formulas
Frequently asked questions
What is a strong correlation?
A common rule of thumb for |r|: below 0.1 negligible, 0.1–0.3 weak, 0.3–0.5 moderate, 0.5–0.7 strong and above 0.7 very strong. What counts as strong depends on your field; in social sciences r = 0.3 is often meaningful.
What does R² mean?
R² is the proportion of variation in Y explained by X. An R² of 0.64 means 64% of the differences in Y are accounted for by the straight-line relationship with X.
Is the Spearman p-value exact?
This tool uses the t approximation for Spearman’s ρ, which is accurate for about 10 or more pairs. For very small samples, exact tables or R’s cor.test give slightly different p-values.
Can I do multiple regression here?
No, this calculator handles one predictor (simple linear regression). For several predictors, use R, Python, SPSS or JASP.
How do I report a correlation in APA style?
Write r(df) = value, p = value, where df = n − 2, for example r(8) = .98, p < .001. Leave out the leading zero, because r cannot exceed 1.
Is my data private?
Yes. Everything is calculated in your browser.