


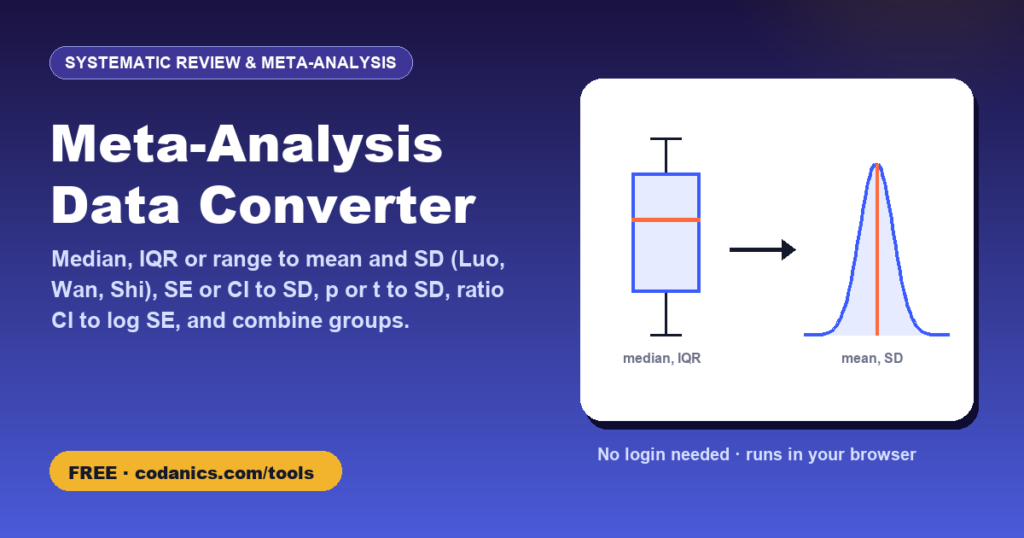
Meta-Analysis Data Converter: Median and IQR to Mean and SD, SE, CI and Combined Groups
Papers rarely report data the way a meta-analysis needs it. Convert medians with quartiles or ranges into means and SDs (Luo 2018, Wan 2014, Shi 2020), standard errors and confidence intervals into SDs, p-values or t into the SD of a mean difference, ratio CIs into log SEs, and combine subgroups into one arm with the Cochrane formula. Do one study or a whole extraction sheet at once.
Fill in what the paper reports. Leave a box empty if it is not given: median + quartiles, median + min/max, or all five.
| Study / arm | n | Min | Q1 | Median | Q3 | Max |
|---|
Add one row per subgroup to merge (for example two doses into one intervention arm, or boys and girls into one group).
| Group | n | Mean | SD |
|---|
- PriceFree, no login or sign-up needed
- Your dataProcessed in your browser, never uploaded
- Works onPhone, tablet or computer, any modern browser
- Made byDr. Muhammad Aammar Tufail, Codanics
- Published17 November 2026
- Last updated16 November 2026
📚 How to cite this tool
This tool is free. If it helped your thesis, paper, report or assignment, please cite it. It keeps the tools free and helps other students find them.
Tufail, M. A. (2026). Meta-analysis data converter: median, IQR and range to mean and SD, SE, CI and combined groups [Online tool]. Codanics. Retrieved 16 November 2026, from https://codanics.com/tools/meta-analysis-data-converter/
In-text citation: (Tufail, 2026) · Narrative: Tufail (2026)
The access date is today’s date, filled in automatically. Author: Muhammad Aammar Tufail. Published 17 November 2026.
How to use the meta-analysis data converter
- Pick the tab that matches what the paper reports: median with quartiles or range, SE or CI, a p-value or t, a ratio with CI, subgroups to merge, or change-from-baseline data.
- Type the numbers. In the median tab leave missing values empty: the tool detects whether you have quartiles (S2), the range (S1) or all five numbers (S3).
- Keep the recommended methods (Luo for the mean, Shi for the SD) unless your protocol says otherwise, and read the skewness warning if one appears.
- For a whole extraction sheet use Batch: paste from Excel or upload a CSV/Excel file, then download the means and SDs as CSV.
- Copy the results and the methods sentence into your extraction form and your paper, then pool them in the meta-analysis calculator.
What this converter does
Most meta-analyses of continuous outcomes pool means and standard deviations, but many papers report a median with an interquartile range (IQR) or a range, a standard error, a confidence interval or only a p-value. Leaving those studies out wastes data and can bias the review. The Cochrane Handbook (chapter 6) describes how to recover the numbers you need. This tool does all of those conversions in one place and shows the formula behind every result.
Median, IQR and range to mean and SD
Three reporting scenarios are covered, using the notation of Wan et al. (2014): S1 (minimum, median, maximum), S2 (Q1, median, Q3) and S3 (all five numbers).
For small samples (n ≤ 50 for the range, n ≤ 201 for the IQR) Wan’s SD uses the exact expected values from Wan et al.’s Tables 1 and 2, exactly as the R package meta does. We checked every scenario against meta::mean_sd_iqr(), mean_sd_range() and mean_sd_iqr_range() (meta 9.0): the results agree to at least 10 significant digits.
The other conversions
Worked example
A trial reports for 40 patients: median 26, IQR 21 to 33, range 12 to 52. With all five numbers (S3), Luo’s weights are w₁ = 0.122 and w₂ = 0.605, giving a mean of 27.33. Shi’s method gives an SD of 9.26. With only the IQR (S2) you would get a mean of 26.71 and an SD of 9.21; with only the range (S1), 27.21 and 9.25. Click Load example to reproduce these numbers.
References
- Hozo SP, Djulbegovic B, Hozo I (2005). Estimating the mean and variance from the median, range, and the size of a sample. BMC Medical Research Methodology 5:13.
- Wan X, Wang W, Liu J, Tong T (2014). Estimating the sample mean and standard deviation from the sample size, median, range and/or interquartile range. BMC Medical Research Methodology 14:135.
- Luo D, Wan X, Liu J, Tong T (2018). Optimally estimating the sample mean from the sample size, median, mid-range, and/or mid-quartile range. Statistical Methods in Medical Research 27(6):1785–1805.
- Shi J, Luo D, Weng H, et al. (2020). Optimally estimating the sample standard deviation from the five-number summary. Research Synthesis Methods 11(5):641–654.
- Higgins JPT, Li T, Deeks JJ (eds). Chapter 6: Choosing effect measures and computing estimates of effect. Cochrane Handbook for Systematic Reviews of Interventions, version 6.5.
Frequently asked questions
Which method should I use to convert a median and IQR to a mean and SD?
The current recommendation is Luo et al. (2018) for the mean and Wan et al. (2014) for the SD when you have the IQR, and Shi et al. (2020) for the SD when you have all five numbers. These are the defaults here and in the R package meta.
Is it acceptable to convert medians in a meta-analysis?
Yes, the Cochrane Handbook allows it, but say so in your methods and run a sensitivity analysis without the converted studies, especially when the data are likely to be skewed.
Can I get the SD from the IQR alone?
Yes. SD ≈ IQR / 1.35 for large samples. For small samples the tool uses the exact divisor from Wan et al. (2014), which is a little smaller than 1.35.
How do I combine two intervention arms into one?
Use the Combine groups tab. It applies the Cochrane Handbook formula, which accounts for both the SDs and the difference between the group means. Simply averaging the SDs is wrong.
The paper only gives p < 0.05. Can I calculate the SD?
Not reliably. You need an exact p-value or the t statistic. With p < 0.001 you can use 0.001 to get a conservative (too large) SD, but say so in your review.
Do my numbers leave my computer?
No. Every calculation runs in your browser and nothing is uploaded or stored.
Do I need to log in or create an account to use the meta-analysis data converter?
No. There is no login, no sign-up and no email required. Open the page and start using it straight away, for free, on any device.
How do I cite this tool in my thesis or paper?
Use the citation box on this page. In APA 7th edition: Tufail, M. A. (2026). Meta-analysis data converter: median, IQR and range to mean and SD, SE, CI and combined groups [Online tool]. Codanics. Retrieved [date you used it], from https://codanics.com/tools/meta-analysis-data-converter/. BibTeX, RIS (EndNote, Mendeley, Zotero), MLA, Harvard, Chicago and Vancouver formats are also available.
Free guides and courses from Codanics
More free tools
See all free Codanics tools → · Codanics on YouTube · WhatsApp channel