


Risk of Bias Plot Generator: Traffic-Light and Summary Plots for RoB 2, ROBINS-I and QUADAS-2
Make the risk-of-bias figures your review needs without R. Choose RoB 2, ROBINS-I, QUADAS-2, the original Cochrane tool or your own domains, enter or paste the judgements for each study, and get a traffic-light plot and a (weighted) summary bar plot in the familiar robvis style, ready for your manuscript as SVG or high-resolution PNG.
- PriceFree, no login or sign-up needed
- Your dataProcessed in your browser, never uploaded
- Works onPhone, tablet or computer, any modern browser
- Made byDr. Muhammad Aammar Tufail, Codanics
- Published17 November 2026
- Last updated16 November 2026
📚 How to cite this tool
This tool is free. If it helped your thesis, paper, report or assignment, please cite it. It keeps the tools free and helps other students find them.
Tufail, M. A. (2026). Risk of bias plot generator: traffic-light and summary plots for RoB 2, ROBINS-I and QUADAS-2 [Online tool]. Codanics. Retrieved 16 November 2026, from https://codanics.com/tools/risk-of-bias-plot-generator/
In-text citation: (Tufail, 2026) · Narrative: Tufail (2026)
The access date is today’s date, filled in automatically. Author: Muhammad Aammar Tufail. Published 17 November 2026.
How to use the risk of bias plot generator
- Choose the risk-of-bias tool you used: RoB 2, ROBINS-I, QUADAS-2, the original Cochrane tool, or your own domain names.
- Enter one row per study and pick the judgement for each domain and overall. Add study weights (for example the meta-analysis weights) if you want a weighted summary plot.
- Or paste/upload a robvis-style table (Study, D1, D2, …, Overall, Weight). Words and symbols (+ − × ! ?) are both recognised.
- Click Draw plots. Switch to the colour-blind palette or the weighted summary if your journal prefers.
- Download each figure as SVG (for editing) or 3× PNG (for submission), copy the figure legend and export the data as CSV.
What these plots show
Systematic reviews report the risk of bias of every included study. Two figures have become standard, popularised by the R package robvis (McGuinness & Higgins, 2021):
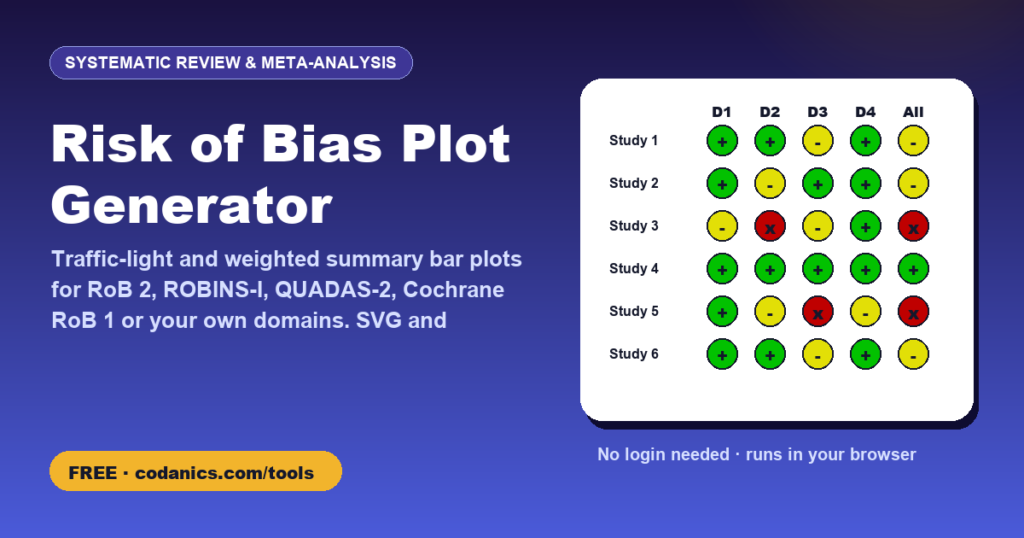
- The traffic-light plot shows one row per study and one circle per domain, coloured by the judgement (low, some concerns, high, and for ROBINS-I also moderate, serious and critical).
- The summary plot shows, for each domain, the proportion of studies (or of the total weight in the meta-analysis) with each judgement.
Supported tools and domains
| Tool | Used for | Domains | Judgements |
|---|---|---|---|
| RoB 2 | Randomised trials | Randomisation; deviations from intended interventions; missing outcome data; measurement of the outcome; selection of the reported result | Low, some concerns, high |
| ROBINS-I | Non-randomised studies of interventions | Confounding; selection of participants; classification of interventions; deviations; missing data; measurement of outcomes; selection of the reported result | Low, moderate, serious, critical, no information |
| QUADAS-2 | Diagnostic accuracy studies | Risk of bias: patient selection, index test, reference standard, flow and timing; applicability concerns: patient selection, index test, reference standard | Low, high, unclear |
| RoB 1 | Older Cochrane reviews | Sequence generation; allocation concealment; blinding of participants and personnel; blinding of outcome assessment; incomplete outcome data; selective reporting; other bias | Low, unclear, high |
The plots only display your judgements; the judgements themselves must come from the signalling questions and algorithms of each tool, ideally made independently by two reviewers. Check agreement between reviewers with the dual-screening agreement calculator.
Tips for publication-quality figures
- Download SVG to adjust fonts or labels in Inkscape, Illustrator or PowerPoint; download PNG (3× resolution) to insert directly into Word.
- Use the weighted summary plot when the review includes a meta-analysis, so the bars show how much of the evidence is at risk, not just how many studies.
- The colour-blind palette uses the same colours as robvis’s “colourblind” option.
Frequently asked questions
Is this the same as robvis?
It draws the same two types of figures with the same symbols and colour schemes, but it runs in your browser instead of R. It is independent of the robvis authors. If your journal or supervisor asks for robvis, you can export the data as CSV in the robvis format and run it in R too.
Can I make a weighted summary plot?
Yes. Enter each study’s weight (for example its weight in the meta-analysis) and choose ‘Weighted by study weight’. Studies without a weight count as 1.
Which judgements does ROBINS-I use?
Low, moderate, serious, critical and no information. The tool switches the choices automatically when you select ROBINS-I.
Can I use my own domains?
Yes. Choose ‘Custom domains’ and type the domain names separated by commas, for example for the Newcastle–Ottawa Scale or JBI checklists.
What resolution are the PNG files?
Three times the screen size (about 300 dpi at the usual print width), which is enough for most journals. For vector graphics, use the SVG.
Is my data saved?
Yes, in this browser only. Nothing is uploaded.
Do I need to log in or create an account to use the risk of bias plot generator?
No. There is no login, no sign-up and no email required. Open the page and start using it straight away, for free, on any device.
How do I cite this tool in my thesis or paper?
Use the citation box on this page. In APA 7th edition: Tufail, M. A. (2026). Risk of bias plot generator: traffic-light and summary plots for RoB 2, ROBINS-I and QUADAS-2 [Online tool]. Codanics. Retrieved [date you used it], from https://codanics.com/tools/risk-of-bias-plot-generator/. BibTeX, RIS (EndNote, Mendeley, Zotero), MLA, Harvard, Chicago and Vancouver formats are also available.
Free guides and courses from Codanics
More free tools
See all free Codanics tools → · Codanics on YouTube · WhatsApp channel