


Normality Test Calculator: Shapiro–Wilk, Anderson–Darling, Q-Q Plot
Check whether your data follow a normal distribution before you run a t-test, ANOVA or Pearson correlation. Paste one or many variables, or a spreadsheet, and get Shapiro–Wilk, Anderson–Darling, Lilliefors and D’Agostino tests, skewness, kurtosis, a Q-Q plot, a histogram and plain-language advice.
- PriceFree, no login or sign-up needed
- Your dataProcessed in your browser, never uploaded
- Works onPhone, tablet or computer, any modern browser
- Made byDr. Muhammad Aammar Tufail, Codanics
- Published16 November 2026
- Last updated16 November 2026
📚 How to cite this tool
This tool is free. If it helped your thesis, paper, report or assignment, please cite it. It keeps the tools free and helps other students find them.
Tufail, M. A. (2026). Normality test calculator [Online tool]. Codanics. Retrieved 16 November 2026, from https://codanics.com/tools/normality-test-calculator/
In-text citation: (Tufail, 2026) · Narrative: Tufail (2026)
The access date is today’s date, filled in automatically. Author: Muhammad Aammar Tufail. Published 16 November 2026.
How to use the normality test calculator
- Type or paste the values of each variable (or each group) into its own box. Use + Add variable or group for more boxes, or load a spreadsheet with Paste from Excel or Upload CSV / Excel. A long-format sheet (a group column and a value column) is split into groups for you.
- Choose the significance level (α = 0.05 is the usual choice).
- Click Test normality. The summary table shows the Shapiro–Wilk result and a verdict for every variable.
- Pick a variable under Details and plots to see all six tests, skewness and kurtosis, the Q-Q plot, the histogram and advice on what to do next.
- Copy the APA sentence for your methods or results section and download the plots as PNG or SVG.
Which normality test should I use?
| Test | Best for | Notes |
|---|---|---|
| Shapiro–Wilk | Most situations, n = 3 to 5000 | The most powerful general test and the one reviewers expect. Use it as your main test. |
| Anderson–Darling | Departures in the tails | Gives extra weight to the tails; a good second opinion. Needs n ≥ 8. |
| Lilliefors (Kolmogorov–Smirnov) | Compatibility with SPSS output | SPSS reports it as “Kolmogorov–Smirnov with Lilliefors correction”. Less powerful than Shapiro–Wilk. |
| D’Agostino skewness and kurtosis | Knowing how the data depart | Tells you whether the problem is asymmetry or tail weight. The omnibus K² combines both (n ≥ 20). |
How to read a Q-Q plot
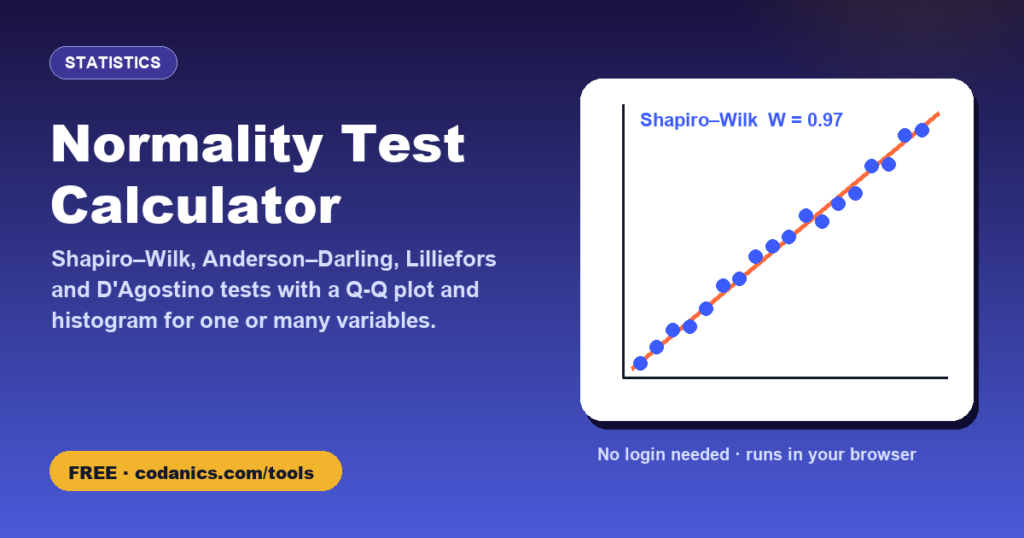
Each point is one observation, plotted against the value you would expect if the data were perfectly normal. If the points lie close to the orange line, the data are approximately normal.
- Curve bending upwards at both ends (a banana shape): right skew. A log transformation often helps.
- S-shape, with ends pulling away from the line in opposite directions: heavy tails or outliers.
- A few isolated points far from the line: possible outliers. Check them against your lab notes before removing anything.
- Steps or horizontal runs: rounded or discrete data such as counts or Likert scores.
Sample size matters
Normality tests answer “is there evidence of non-normality?”, not “is the departure big enough to matter?”. With small samples (n < 20) they rarely detect anything, so a non-significant result is weak reassurance. With large samples (n > 100) they flag tiny, harmless departures. In both cases, look at the Q-Q plot, skewness and kurtosis as well. As a rough guide, |skewness| < 1 and |excess kurtosis| < 2 are rarely a problem for t-tests and ANOVA.
Formulas
Results match R: shapiro.test(), nortest::ad.test(), nortest::lillie.test(), moments::agostino.test() and moments::anscombe.test(). Skewness and kurtosis match SPSS and Excel (SKEW, KURT).
How to report a normality test
In the methods: “Normality was assessed with the Shapiro–Wilk test and inspection of Q-Q plots.” In the results, if needed: “Plant height did not deviate significantly from normality, W = 0.97, p = .52.” If you transform the data, say so and report the test on the transformed values. Learn more in our free guide to data distributions in statistics.
Frequently asked questions
Which normality test is best?
The Shapiro–Wilk test is the most powerful general-purpose test and the one most journals expect. Use it as your main test, and add a Q-Q plot. Anderson–Darling is a good second opinion when you care about the tails.
My Shapiro–Wilk p-value is below 0.05. Can I still use a t-test or ANOVA?
Often yes. With moderate or large samples (roughly 30 or more per group), t-tests and ANOVA are robust to mild non-normality. Check the Q-Q plot and skewness. If the data are strongly skewed, try a log transformation or a non-parametric test such as Mann–Whitney or Kruskal–Wallis.
Should I test normality on all data together or per group?
Per group, or on the residuals of your model. Mixing groups with different means can make the pooled data look non-normal even when each group is normal.
Why does SPSS give a different Kolmogorov–Smirnov p-value?
SPSS reports the Kolmogorov–Smirnov test with the Lilliefors correction, which this tool shows as ‘Lilliefors (Kolmogorov–Smirnov)’. SPSS truncates large p-values at .200, so its numbers can look different even when the test is the same.
What are acceptable skewness and kurtosis values?
There is no strict rule, but skewness between −1 and +1 and excess kurtosis between −2 and +2 are usually considered acceptable for t-tests and ANOVA. Some authors use z-scores (value divided by its SE) and flag |z| > 1.96 for small samples or |z| > 3.29 for medium samples.
Is my data uploaded anywhere?
No. All calculations run in your browser. Files you open are read on your own device and nothing is sent to a server.
Do I need to log in or create an account to use the normality test calculator?
No. There is no login, no sign-up and no email required. Open the page and start using it straight away, for free, on any device.
How do I cite this tool in my thesis or paper?
Use the citation box on this page. In APA 7th edition: Tufail, M. A. (2026). Normality test calculator [Online tool]. Codanics. Retrieved [date you used it], from https://codanics.com/tools/normality-test-calculator/. BibTeX, RIS (EndNote, Mendeley, Zotero), MLA, Harvard, Chicago and Vancouver formats are also available.
Free guides and courses from Codanics
More free tools
See all free Codanics tools → · Codanics on YouTube · WhatsApp channel