


Two-Way ANOVA Calculator with Interaction, Simple Effects, Tukey and Plot
Test two factors and their interaction at once, for example fertilizer × irrigation or drug × sex. Paste long-format data and get the ANOVA table with partial η², simple effects, Tukey letters, Levene’s test, an interaction plot and APA sentences.
- PriceFree, no login or sign-up needed
- Your dataProcessed in your browser, never uploaded
- Works onPhone, tablet or computer, any modern browser
- Made byDr. Muhammad Aammar Tufail, Codanics
- Published16 November 2026
- Last updated16 November 2026
📚 How to cite this tool
This tool is free. If it helped your thesis, paper, report or assignment, please cite it. It keeps the tools free and helps other students find them.
Tufail, M. A. (2026). Two-way ANOVA calculator [Online tool]. Codanics. Retrieved 16 November 2026, from https://codanics.com/tools/two-way-anova-calculator/
In-text citation: (Tufail, 2026) · Narrative: Tufail (2026)
The access date is today’s date, filled in automatically. Author: Muhammad Aammar Tufail. Published 16 November 2026.
How to use the two-way anova calculator
- Arrange your data in long format: one row per plant, plot or person, with a column for factor A, a column for factor B and a column for the measured value. The example (fertilizer × irrigation, 4 replicates) is loaded so you can see the layout.
- Type or paste the data into the box, or use Paste from Excel or Upload CSV / Excel and pick the three columns.
- Keep Type II sums of squares (or choose Type III to match SPSS) and click Run two-way ANOVA.
- Read the interaction first. If it is significant, use the simple-effects tests (the effect of each factor at each level of the other, with letters inside each level) or compare all treatment combinations. If it is not significant, use the main-effect Tukey letters.
- Copy the APA sentence and the ANOVA table, and download the interaction plot as PNG or SVG for your thesis.
When to use a two-way ANOVA
Use a two-way (factorial) ANOVA when you have one continuous outcome and two categorical factors, and every level of one factor is combined with every level of the other. Typical examples: fertilizer × irrigation on yield, drug × sex on blood pressure, variety × salinity on root length. It answers three questions in one analysis: does factor A matter, does factor B matter, and does the effect of A depend on B (the interaction)?
| Your design | Use |
|---|---|
| One factor with 3+ groups | One-way ANOVA |
| Two factors, completely randomised | Two-way ANOVA (this tool) |
| Field trial with blocks (RCBD) | Field-trial ANOVA |
| Not sure | Which statistical test should I use? |
How to read the interaction
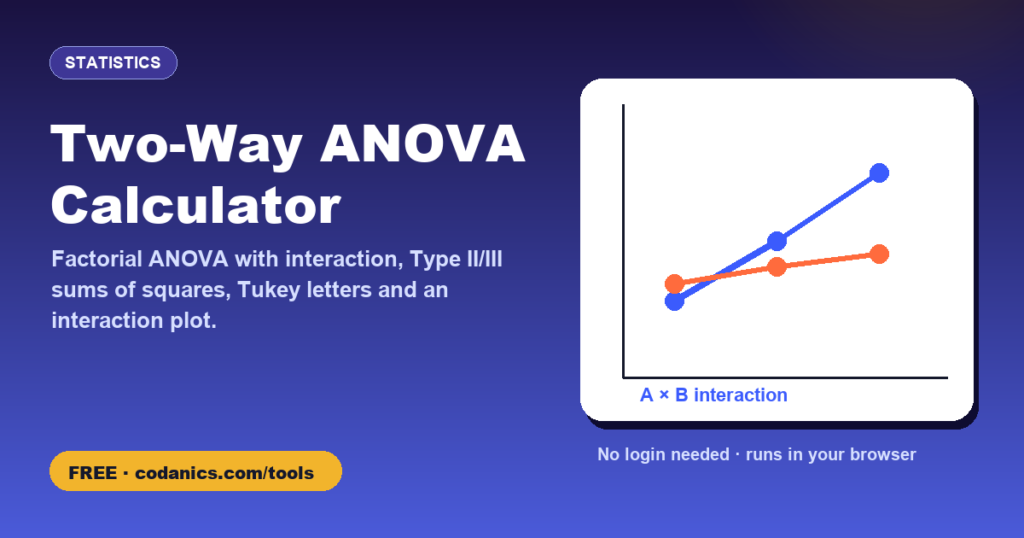
An interaction means the lines in the interaction plot are not parallel. In the example, irrigation raises yield under every fertilizer, but much more with NPK than with no fertilizer. When the interaction is significant, a main effect averages over very different situations, so report simple effects instead of relying on the main effects alone.
Simple effects after a significant interaction
A simple effect is the effect of one factor at a single level of the other factor, for example the effect of fertilizer under rainfed conditions and, separately, under irrigation. The tool runs an F test for every level of each factor and then compares the levels within each one (Tukey HSD or Bonferroni), giving letters that apply within a column only. All tests use the pooled error term (MS error and df) of the full two-way model, which is more powerful than running separate one-way ANOVAs and matches emmeans::joint_tests(model, by = "irrigation") and pairs(emmeans(model, ~ fertilizer | irrigation)) in R.
Type II or Type III sums of squares?
With a balanced design (the same number of replicates in every combination) all types give the same answer. With unbalanced data they differ:
- Type II tests each main effect after the other main effect. It is more powerful when there is no interaction, and it is the default in R’s
car::Anova(). - Type III tests each effect after all the others, using sum-to-zero contrasts. It is the default in SPSS, SAS and Minitab, and it is the usual choice when the interaction is significant.
Type I (sequential) sums of squares depend on the order of the factors, so they are not offered here.
Assumptions
- Independent observations: each value comes from a different experimental unit.
- Normal residuals within each combination. Check with the normality test calculator; ANOVA is fairly robust with similar group sizes.
- Equal variances across the combinations. The tool reports Levene’s test (median-centred by default, which is robust and matches R’s
car::leveneTest()).
How to report a two-way ANOVA
Report the interaction first, then each main effect, each with F(df effect, df error), p and partial η², followed by the post-hoc results. For example: “There was a significant interaction between fertilizer and irrigation, F(2, 18) = 18.84, p < .001, partial η² = .68.” Present the means with letters in a table or a bar chart made with the publication chart maker.
library(car); options(contrasts = c("contr.sum","contr.poly")); m <- lm(yield ~ fertilizer * irrigation, data = d); Anova(m, type = 2), then emmeans::emmeans(m, pairwise ~ fertilizer) for Tukey. Learn it step by step in the R with Aammar course.Frequently asked questions
What is the difference between one-way and two-way ANOVA?
A one-way ANOVA compares groups defined by one factor. A two-way ANOVA has two factors at once and also tests their interaction, that is, whether the effect of one factor changes with the level of the other.
What does a significant interaction mean?
It means the effect of one factor depends on the other factor. On the interaction plot the lines are not parallel. Interpret the main effects with care and compare the treatment combinations instead.
Should I use Type II or Type III sums of squares?
For balanced data it does not matter. For unbalanced data, Type II is more powerful when there is no interaction, while Type III (the SPSS default) is common when the interaction is significant. State which one you used in your methods.
Can I run a two-way ANOVA with unequal sample sizes?
Yes. The tool fits a linear model and gives Type II or Type III sums of squares, and Tukey comparisons use estimated marginal means, which handle unequal group sizes correctly. Every factor combination needs at least one observation.
What are simple effects in a two-way ANOVA?
Simple effects test one factor at each single level of the other factor (for example fertilizer within rainfed and within irrigated plots). They are the standard follow-up when the interaction is significant. The tool uses the pooled error term of the full model, as emmeans does in R, and adds Tukey or Bonferroni comparisons with letters inside each level.
What do the letters a, b, c mean?
They are a compact letter display of the Tukey test. Means that share a letter are not significantly different; means with no letter in common differ at the chosen α.
How do I report a two-way ANOVA in APA style?
Give F(df effect, df error), p and partial η² for the interaction and both main effects, then the post-hoc comparisons. The tool writes the sentence and lets you copy the ANOVA table.
Is my data uploaded?
No. All calculations run in your browser. Pasted or uploaded files never leave your computer.
Do I need to log in or create an account to use the two-way anova calculator?
No. There is no login, no sign-up and no email required. Open the page and start using it straight away, for free, on any device.
How do I cite this tool in my thesis or paper?
Use the citation box on this page. In APA 7th edition: Tufail, M. A. (2026). Two-way ANOVA calculator [Online tool]. Codanics. Retrieved [date you used it], from https://codanics.com/tools/two-way-anova-calculator/. BibTeX, RIS (EndNote, Mendeley, Zotero), MLA, Harvard, Chicago and Vancouver formats are also available.
Free guides and courses from Codanics
More free tools
See all free Codanics tools → · Codanics on YouTube · WhatsApp channel