Code
from IPython.display import Image
Image("outliers.png")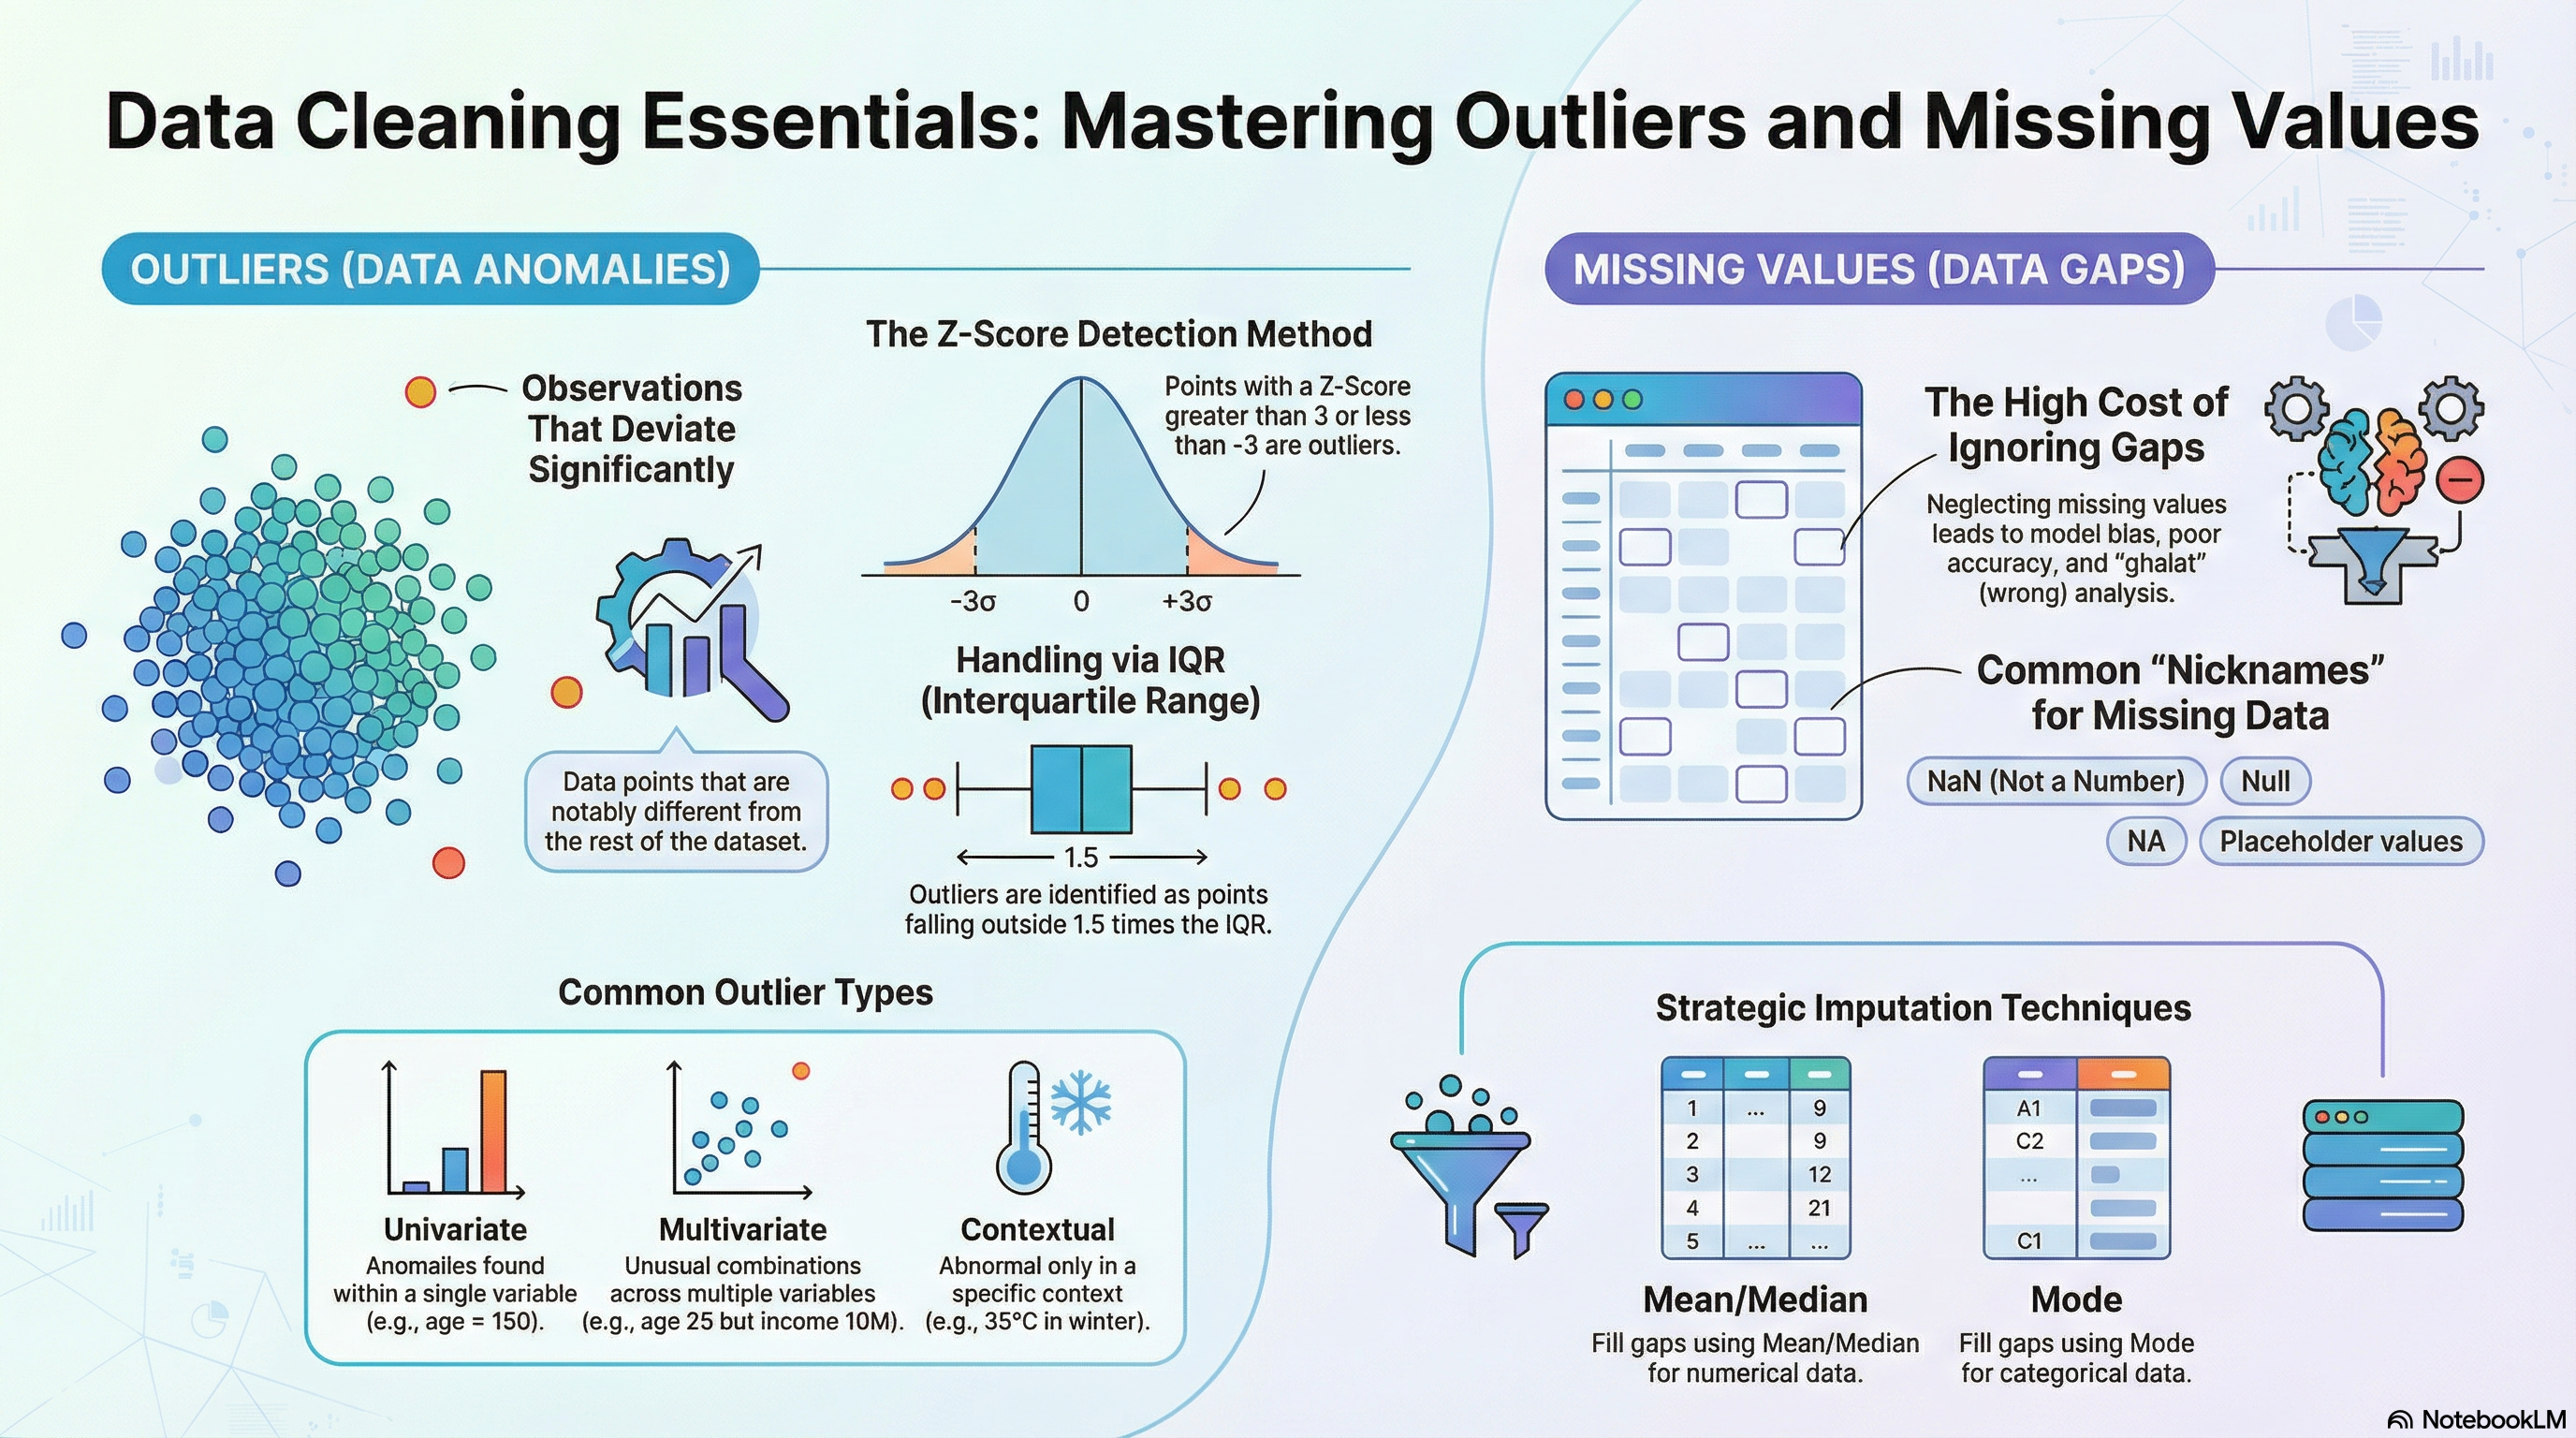
Data Mein Ghair Mamooli Cheezon ki Talash 🕵️♂️📊
Jab hum data ko samajhne aur us se insights nikalne ki baat karte hain, to kuch aise elements hote hain jo baqi data se hat ke hote hain. Inhe hum ‘anomalies’ ya ‘outliers’ kehte hain. Is chapter mein, hum inhi anomalies ko kaise pehchanein, unka kya asar hota hai, aur unhen kaise handle karein, is par baat karenge.
Outliers woh data points hote hain jo baqi data set se kafi alag hote hain.
Outliers are also known as: 1. Abberrant observations 2. Deviants 3. Outlying cases 4. Anomalous points 5. Abnormalities
Outliers ko nine types mein classify kiya ja sakta hai:
Outliers ki wajah kuch bhi ho sakti hai. Kuch common causes neeche diye gaye hain:
Here you can see a comple understanding about outliers in this figure.
from IPython.display import Image
Image("outliers.png")Outliers ko identify karne ke liye, hum kuch techniques use karte hain. In techniques ko hum ‘Outlier Detection Techniques’ kehte hain. In techniques mein se kuch neeche diye gaye hain:
Ham sirf Z-Score, IQR or k-means clustering ko dekhenge.
Z-Score method mein, hum ye dekhte hain ke koi data point kitne standard deviations (SD) dur hai mean se.
Z-Score ki formula ye hai: \[Z = \frac{x - \mu}{\sigma}\]
Where:
\(Z\): is the Z-Score
\(x\): is the data point
\(\mu\): is the mean of the data
\(\sigma\): is the standard deviation of the data
\(x - \mu\): is the difference between the data point and the mean
\(\frac{x - \mu}{\sigma}\): is the difference between the data point and the mean in terms of standard deviations
Z-Score ki properties ye hain: 1. Z-Score ka mean 0 aur standard deviation 1 hota hai. 2. Z-Score ki value jitni zyada hogi, utna data point mean se zyada dur hoga. 3. Z-Score ki value jitni kam hogi, utna data point mean ke qareeb hoga. 4. Z-Score ki value 3 se zyada ya -3 se kam hogi, to data point outlier hoga.
Z-Score ki values ko interpret karne ke liye, neeche diye gaye table ko dekhein:
| Z-Score | Data Point | Interpretation |
|---|---|---|
| -3 | 3 SDs below the mean | Outlier |
| -2 | 2 SDs below the mean | Outlier |
| -1 | 1 SD below the mean | Outlier |
| 0 | Mean | Not an outlier |
| 1 | 1 SD above the mean | Not an outlier |
| 2 | 2 SDs above the mean | Not an outlier |
| 3 | 3 SDs above the mean | Not an outlier |
Z-Score method ko Python mein implement karne ke liye, neeche diye gaye steps follow karein:
numpyRun the code below to see the steps.
# Step 1: Import the required libraries
import pandas as pd
import numpy as np

# Step 2: Create the data
data = pd.DataFrame({'Age': [20, 21, 22, 23, 24, 25, 26, 27, 28, 29, 30, 50]})

# Step 3: Calculate the mean and standard deviation
mean = np.mean(data['Age'])
std = np.std(data['Age'])

# Step 4: Calculate the Z-Score
data['Z-Score'] = (data['Age'] - mean) / std

# Step 5: Print the data
print("----------------------------------------")
print(f"Here is the data with outliers:\n {data}")
print("----------------------------------------")
# Step 6: Print the outliers
print(f"Here are the outliers based on the z-score threshold, 3:\n {data[data['Z-Score'] > 3]}")
print("----------------------------------------")
# Step 7: Remove the outliers
data = data[data['Z-Score'] <= 3]

# Step 8: Print the data without outliers
print(f"Here is the data without outliers:\n {data}")
----------------------------------------
Here is the data with outliers:
Age Z-Score
0 20 -0.938954
1 21 -0.806396
2 22 -0.673838
3 23 -0.541280
4 24 -0.408721
5 25 -0.276163
6 26 -0.143605
7 27 -0.011047
8 28 0.121512
9 29 0.254070
10 30 0.386628
11 50 3.037793
----------------------------------------
Here are the outliers based on the z-score threshold, 3:
Age Z-Score
11 50 3.037793
----------------------------------------
Here is the data without outliers:
Age Z-Score
0 20 -0.938954
1 21 -0.806396
2 22 -0.673838
3 23 -0.541280
4 24 -0.408721
5 25 -0.276163
6 26 -0.143605
7 27 -0.011047
8 28 0.121512
9 29 0.254070
10 30 0.386628scipy libraryYou can also follow the steps below to implement the Z-Score method in Python, using scipy library:
Run the code below to see the steps.
# Import libraries
import numpy as np
from scipy import stats

# Sample data
data = [2.5, 2.7, 2.8, 3.0, 3.2, 3.4, 3.6, 3.8, 4.0, 110.0]

# Calculate the Z-score for each data point
z_scores = np.abs(stats.zscore(data))

# Set a threshold for identifying outliers
threshold = 2.5
outliers = np.where(z_scores > threshold)[0]

# print the data
print("----------------------------------------")
print("Data:", data)
print("----------------------------------------")

print("Indices of Outliers:", outliers)
print("Outliers:", [data[i] for i in outliers])

# Remove outliers
data = [data[i] for i in range(len(data)) if i not in outliers]
print("----------------------------------------")
print("Data without outliers:", data)
----------------------------------------
Data: [2.5, 2.7, 2.8, 3.0, 3.2, 3.4, 3.6, 3.8, 4.0, 110.0]
----------------------------------------
Indices of Outliers: [9]
Outliers: [110.0]
----------------------------------------
Data without outliers: [2.5, 2.7, 2.8, 3.0, 3.2, 3.4, 3.6, 3.8, 4.0]IQR method mein, hum ye dekhte hain ke koi data point kitne IQRs dur hai median se.
IQR ki formula ye hai:
\[IQR = Q_3 - Q_1\]
Where:
\(IQR\): is the Interquartile Range
\(Q_3\): is the third quartile
\(Q_1\): is the first quartile
\(Q_3 - Q_1\): is the difference between the third quartile and the first quartile
IQR ki properties ye hain:
IQR method ko Python mein implement karne ke liye, neeche diye gaye steps follow karein:
numpyRun the code below to see the steps.
# Step 1: Import the required libraries
import pandas as pd
import numpy as np

# Step 2: Create the data
data = pd.DataFrame({'Age': [20, 21, 22, 23, 24, 25, 26, 27, 28, 29, 30, 50]})

# Step 3: Calculate the first and third quartile
Q1 = np.percentile(data['Age'], 25, interpolation = 'midpoint')
Q3 = np.percentile(data['Age'], 75, interpolation = 'midpoint')

# Step 4: Calculate the IQR
IQR = Q3 - Q1

# Step 5: Calculate the lower and upper bound
lower_bound = Q1 - (1.5 * IQR)
upper_bound = Q3 + (1.5 * IQR)

# Step 6: Print the data
print("----------------------------------------")
print(f"Here is the data with outliers:\n {data}")
print("----------------------------------------")
# Step 7: Print the outliers
print(f"Here are the outliers based on the IQR threshold:\n {data[(data['Age'] < lower_bound) | (data['Age'] > upper_bound)]}")
print("----------------------------------------")
# Step 8: Remove the outliers
data = data[(data['Age'] >= lower_bound) & (data['Age'] <= upper_bound)]

# Step 9: Print the data without outliers
print(f"Here is the data without outliers:\n {data}")
----------------------------------------
Here is the data with outliers:
Age
0 20
1 21
2 22
3 23
4 24
5 25
6 26
7 27
8 28
9 29
10 30
11 50
----------------------------------------
Here are the outliers based on the IQR threshold:
Age
11 50
----------------------------------------
Here is the data without outliers:
Age
0 20
1 21
2 22
3 23
4 24
5 25
6 26
7 27
8 28
9 29
10 30Clustering method mein, hum data points ko clusters mein divide karte hain. This can be done using the K-Means clustering algorithm. Where we specify the number of clusters we want to divide the data into. Then we assign each data point to a cluster. Then we calculate the distance of each data point from the centroid of the cluster it belongs to. Then we remove the data points that are farthest from the centroid of the cluster they belong to.
Use the code below to see the steps.
# Import library
from sklearn.cluster import KMeans

# Sample data
data = [[2, 2], [3, 3], [3, 4], [30, 30], [31, 31], [32, 32]]

# Create a K-means model with two clusters (normal and outlier)
kmeans = KMeans(n_clusters=2, n_init=10)
kmeans.fit(data)

# Predict cluster labels
labels = kmeans.predict(data)

# Identify outliers based on cluster labels
outliers = [data[i] for i, label in enumerate(labels) if label == 1]

# print data
print("Data:", data)
print("Outliers:", outliers)
# Remove outliers
data = [data[i] for i, label in enumerate(labels) if label == 0]
print("Data without outliers:", data)
Data: [[2, 2], [3, 3], [3, 4], [30, 30], [31, 31], [32, 32]]
Outliers: [[2, 2], [3, 3], [3, 4]]
Data without outliers: [[30, 30], [31, 31], [32, 32]]Outliers ko handle karne ke liye, hum kuch techniques use karte hain. In techniques ko hum ‘Outlier Handling Techniques’ kehte hain. In techniques mein se kuch neeche diye gaye hain:
I have explained some of these techniques in the section above.. Where we remove the outliers using the Z-Score, IQR and K-Means clustering methods. You can also use the other techniques by yourself and practice them.
Missing Values Ko Kaise Handle Kiya Jaye? Aur Inhe Handle Karna Kyun Zaroori Hai?” - Data Science Ki Dunia Mein Iska Role 🤔🛠️
Missing values yaani ghaib data se guzarne wala har data scientist ya researcher ko iski ahmiyat aur isse judi mushkilaat ka andaza ho sakta hai. Data Science ki duniya mein, yeh missing values se guzarne ka tajurba aksar humein milta hai. Agar aap mein se kuch khush naseeb hain jo is masle se guzre nahi, toh woh waqai kismat wale hain! 😄 Lekin un logon ke liye jo is masle ka samna karte hain, unko yeh samajhne mein mushkil nahi hoti ke missing values kitne masail paida kar sakti hain.
Lahore ki ek mashhoor company Codanics Solutions mein Ahmed ek talented data scientist tha. Woh apne projects ko hamesha top priority deta tha aur is wajah se us ki company mein bhi bohat izzat thi. 🌟
Ek roz, Ahmed apne doston ke sath lunch kar raha tha. 🍛
Ali (ek aur data scientist): “Ahmed bhai! Suna hai aap ko naya project mila hai?”
Ahmed: “Ji haan, Ali. Mujhe customers ki buying habits analyze karni hai. Lekin data mein kuch missing values hain, mujhe lagta hai koi masla nahi hoga agar main unhein ignore kar doon.” 😕
Ali: “Bhai, kabhi bhi missing values ko ignore mat karo. Yeh choti si baat model ki performance ko kharab kar sakti hai.”
Lekin Ahmed ne Ali ki baat ko nazar andaaz kiya aur apne tareeque se kaam karna shuru kar diya.
Jab model tayyar hua aur us ko real-world data par test kiya gaya, to us ki predictions bilkul bhi sahi nahi thi. 😲 Company ko is wajah se bohat bada nuqsan hua.
CEO, Mr. Usman, ne Ahmed ko apne office mein bulaya. 🏢
Mr. Usman: “Ahmed, humein bohat zyada nuqsan hua hai is project se. Kya masla hai?”
Ahmed: “Sir, maine socha tha ke kuch missing values se koi masla nahi hoga. Lekin mujhe ab samajh aaya hai ke maine ghalat socha.” 😔
Mr. Usman: “Ahmed, aap jante hain data science mein kitni bhi choti ghalti badi problem create kar sakti hai. Mujhe afsos hai, lekin humein aap ko company se nikalna parega.”
Ahmed ko bohat afsos hua. Us ne realize kiya ke kabhi bhi data ko lightly nahi lena chahiye. Woh ghar wapas laut kar Ali ko call kiya. 📞
Ahmed: “Ali, tum sahi keh rahe the. Mujhe company se nikal diya gaya hai.”
Ali: “Afsos hai sun kar. Lekin Ahmed, har galti se humein kuch na kuch seekhne ko milta hai. Aap ab better tareeque se kaam karenge.”
Ahmed ne apni galti se seekha aur woh ab missing values aur data preprocessing par khaas tawajjo dene laga. Chand mahine baad, Ahmed ne ek aur company mein job shuru ki, aur wahan us ne prove kiya ke woh ek maahir data scientist hai. Lekin, us ek ghalti ka sabak us ne hamesha yaad rakha.
Ab agar ap b ahmad ki trah risk lena chahtay hyn tu missing values ko seekhnay se pehlay ap is blog ko ignore kar den, warna agar ap interested hyn tu yaqeen manen ye blog ap ki Data Science or AI ki journey ko bht kamal karne wala hy, I know ap soch rahay hun gay k aisa kia hy is main, Q fir Pola Payen kareay Start? Han Bholay phir tayyar ho?
I know ye nick names hyn magar isi trah or b bht se nick names hyn missing values k, By the way ap apna nick name likhen gay comments main?
Agar ap b aik desi culture ki paidawar hyn tu ap k bhi bht saray ultay naam gay. hai na? like Achoo, Billa, Bhola, Pola, Saji, kala, chitta, mota, chota, kaddu etc., ye main nahi keh raha ap kahin b nazar dorayen tu aisay naaam htay hyn, or kuch tu bht hi adab se pukaray jatay hyn, jaisa k, Paye Kalay. Ab isi trah missing values k bhi naam hyn kaafi jo agar ap ko na pata hun tu ap preshan hun gay. Chalein phir dekhtay hyn!
Missing values ko mukhtalif namon se pukara jata hai, depend karta hai ke context kya hai aur kis domain ya field mein baat ho rahi hai. Lekin, Data Science aur statistics mein commonly istemal hone wale names hain:
In tamaam terms mein se kuch specific situations ya tools ke liye hote hain, jabke baaz aam istemal ke liye hote hain. Hamesha zaroori hai ke jab aap data ko analyze ya preprocess kar rahe hoon, toh aap in different types ke missing values ko pehchanein aur unhein sahi tareeqay se handle karein.
Missing values ko identify karne ke liye, hum kuch techniques use karte hain. In techniques ko hum ‘Missing Value Detection Techniques’ kehte hain. In techniques mein se kuch neeche diye gaye hain:
Visual Inspection mein, hum data ko visualize kar ke missing values ko identify karte hain.
Use the code below to see the steps.
# Import libraries
import pandas as pd
import numpy as np
import matplotlib.pyplot as plt
import seaborn as sns

# Load titanic dataset
data = sns.load_dataset('titanic')

# Visualize the data
plt.figure(figsize=(8, 5))
sns.heatmap(data.isnull(), cbar=False)
plt.show()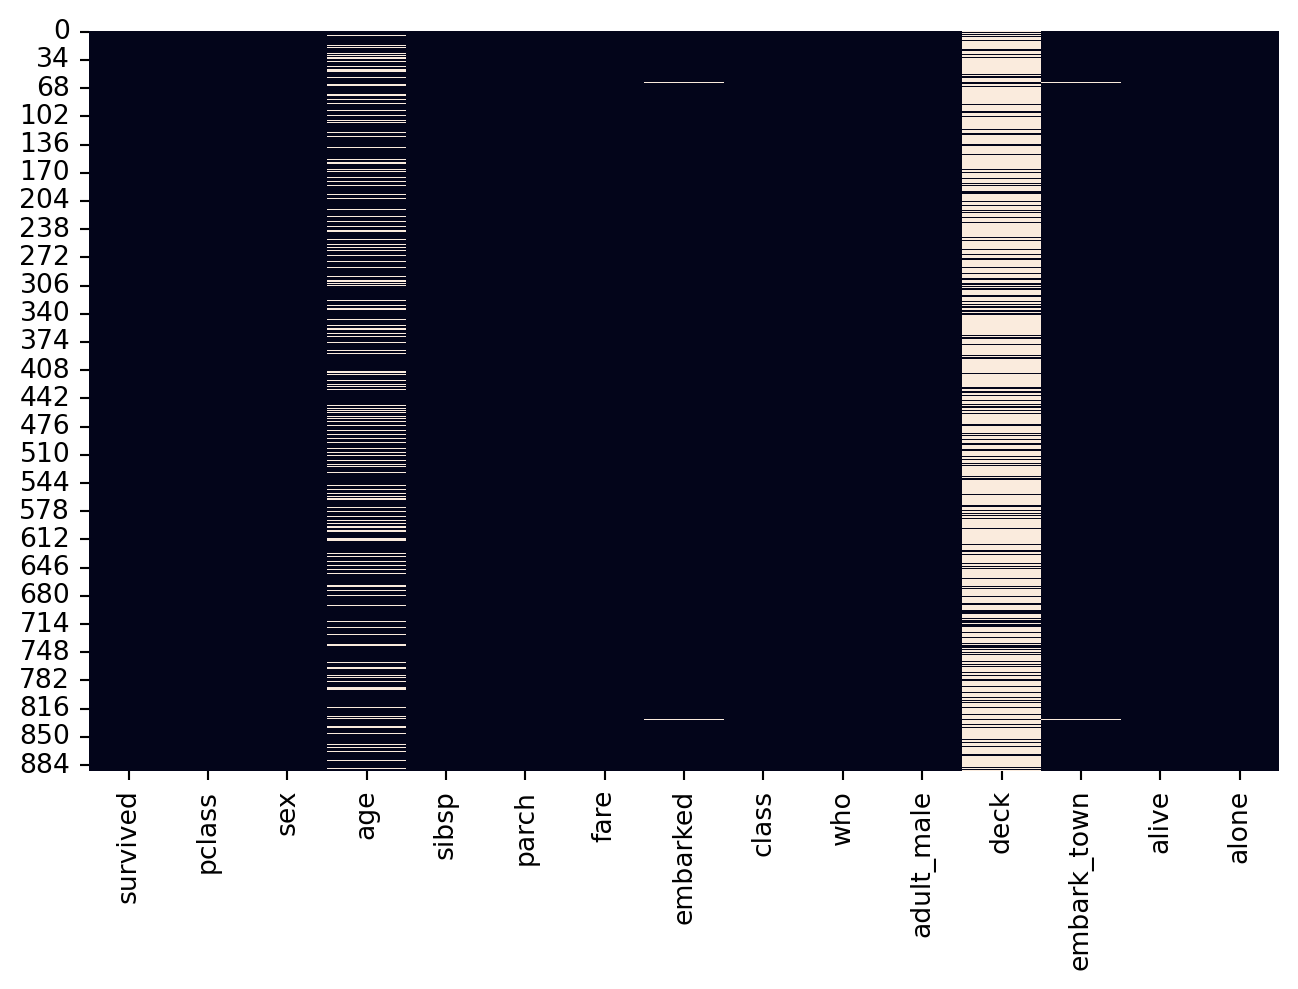
Descriptive Statistics mein, hum data ki descriptive statistics ko calculate kar ke missing values ko identify karte hain.
Use the code below to see the steps.
# Import libraries
import pandas as pd
import numpy as np
import seaborn as sns
# load titanic dataset
data = sns.load_dataset('titanic')

# calculate missing values
print("----------------------------------------")
print(f"Missing values in each column:\n{data.isnull().sum().sort_values(ascending=False)}")
print("----------------------------------------")
print(f"Percentage of missing values in each column:\n{round(data.isnull().sum() / len(data) * 100, 2).sort_values(ascending=False)}")
----------------------------------------
Missing values in each column:
deck 688
age 177
embarked 2
embark_town 2
survived 0
pclass 0
sex 0
sibsp 0
parch 0
fare 0
class 0
who 0
adult_male 0
alive 0
alone 0
dtype: int64
----------------------------------------
Percentage of missing values in each column:
deck 77.22
age 19.87
embarked 0.22
embark_town 0.22
survived 0.00
pclass 0.00
sex 0.00
sibsp 0.00
parch 0.00
fare 0.00
class 0.00
who 0.00
adult_male 0.00
alive 0.00
alone 0.00
dtype: float64Missingno library ko use kar ke bhi hum missing values ko identify kar sakte hain.
Use the code below to see the steps.
# Import libraries
import pandas as pd
import numpy as np
import seaborn as sns

df = sns.load_dataset('titanic')
df| survived | pclass | sex | age | sibsp | parch | fare | embarked | class | who | adult_male | deck | embark_town | alive | alone | |
|---|---|---|---|---|---|---|---|---|---|---|---|---|---|---|---|
| 0 | 0 | 3 | male | 22.0 | 1 | 0 | 7.2500 | S | Third | man | True | NaN | Southampton | no | False |
| 1 | 1 | 1 | female | 38.0 | 1 | 0 | 71.2833 | C | First | woman | False | C | Cherbourg | yes | False |
| 2 | 1 | 3 | female | 26.0 | 0 | 0 | 7.9250 | S | Third | woman | False | NaN | Southampton | yes | True |
| 3 | 1 | 1 | female | 35.0 | 1 | 0 | 53.1000 | S | First | woman | False | C | Southampton | yes | False |
| 4 | 0 | 3 | male | 35.0 | 0 | 0 | 8.0500 | S | Third | man | True | NaN | Southampton | no | True |
| ... | ... | ... | ... | ... | ... | ... | ... | ... | ... | ... | ... | ... | ... | ... | ... |
| 886 | 0 | 2 | male | 27.0 | 0 | 0 | 13.0000 | S | Second | man | True | NaN | Southampton | no | True |
| 887 | 1 | 1 | female | 19.0 | 0 | 0 | 30.0000 | S | First | woman | False | B | Southampton | yes | True |
| 888 | 0 | 3 | female | NaN | 1 | 2 | 23.4500 | S | Third | woman | False | NaN | Southampton | no | False |
| 889 | 1 | 1 | male | 26.0 | 0 | 0 | 30.0000 | C | First | man | True | C | Cherbourg | yes | True |
| 890 | 0 | 3 | male | 32.0 | 0 | 0 | 7.7500 | Q | Third | man | True | NaN | Queenstown | no | True |
891 rows × 15 columns
Titanic Dataset
# Import libraries
import pandas as pd
import numpy as np
import missingno as msno
import matplotlib.pyplot as plt
import seaborn as snss

# load titanic dataset
data = sns.load_dataset('titanic')
# Visualize the data
msno.matrix(data,labels=True, fontsize=12, width_ratios=(2, 4), color=(0.2, 0.4, 0.6))
plt.show()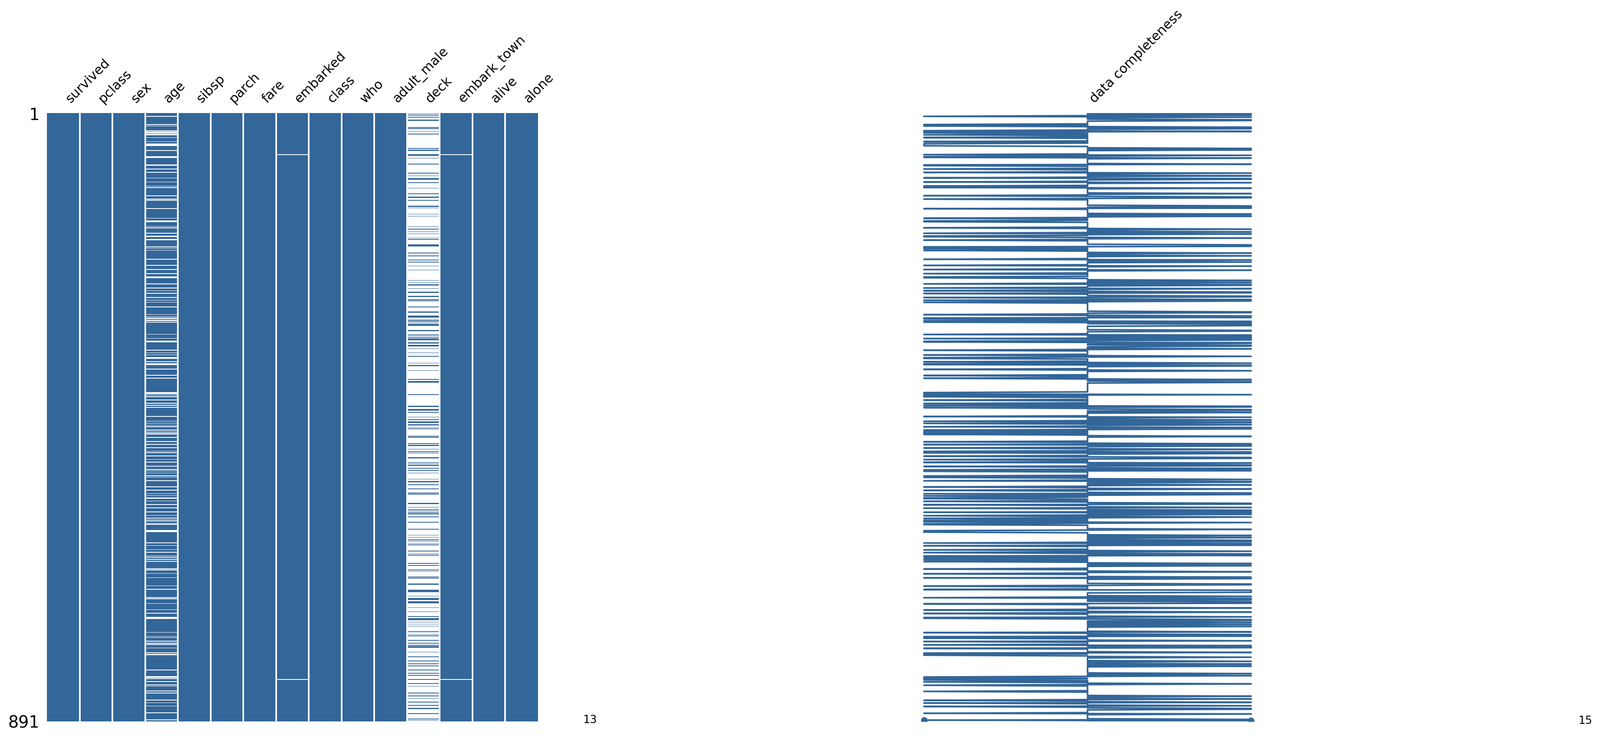
Missing values ka hona kisi bhi dataset mein aam baat hai, lekin jab hum decide karte hain ke kisi column ko remove karna chahiye ya nahi, to iska faisla humein kuch factors par depend karta hai:
Data Ki Quantity: Agar aapke paas bohat zyada data hai aur aik specific column mein missing values ki tadad bohat zyada hai (masalan, 70% ya 80%), toh us column ko remove kar dena behtar ho sakta hai, kyun ke us column se faida uthana mushkil ho sakta hai.
Column Ki Importance: Agar missing values wala column aapke analysis ya model ke liye bohat ahem hai, toh us column ko remove karna acha nahi hoga. Aise mein aap missing values ko impute karne ke tareeqe istemal kar sakte hain.
Nature of Data: Kabhi-kabhi, missing values ka hona bhi kuch indicate karta hai. Masalan, kisi survey mein, agar kisi sawal ka jawab nahi diya gaya, toh yeh indicate kar sakta hai ke participant us sawal se comfortable nahi tha. Aise mein, missing value ko hata dena ya replace karna sahi nahi hoga.
Model Ki Sensitivity: Kuch machine learning models missing values ko handle kar sakte hain, jabke kuch models sensitive hoti hain. Aise mein, agar model missing values ke sensitive hai, toh aapko missing values ko handle karna parega.
Type of Data: Numeric data mein missing values ko mean, median ya mode se replace kiya ja sakta hai. Categorical data mein, missing values ko mode ya kisi specific category se replace kiya ja sakta hai.
Aam taur par, agar aapke column mein 50% se zyada data missing hai, toh us column ko consider karna chahiye ke kya usse remove karna behtar rahega ya nahi. Lekin, yeh hard and fast rule nahi hai. Har dataset unique hota hai aur uski requirements bhi alag hoti hain. Is liye, aapko har dataset ke context mein decide karna hoga ke missing values ko kaise handle kiya jaye.
Use following code to see the steps to fill missing values with mean, median or mode in Python:
1. Mean
# Import libraries
import pandas as pd
import numpy as np

# Create the data
data = pd.DataFrame({'Age': [20, 21, 22, 23, 24, 25, 26, 27, 28, 29, np.nan, 50]})

# Print the data with missing value
print("----------------------------------------")
print(f"Here is the data with missing value:\n {data}")

# Calculate the mean
mean = data['Age'].mean()

# Replace the missing values with mean
data['Age'] = data['Age'].fillna(mean)
print("----------------------------------------")
# Print the data without missing value
print(f"Here is the data without missing value:\n {data}")
----------------------------------------
Here is the data with missing value:
Age
0 20.0
1 21.0
2 22.0
3 23.0
4 24.0
5 25.0
6 26.0
7 27.0
8 28.0
9 29.0
10 NaN
11 50.0
----------------------------------------
Here is the data without missing value:
Age
0 20.000000
1 21.000000
2 22.000000
3 23.000000
4 24.000000
5 25.000000
6 26.000000
7 27.000000
8 28.000000
9 29.000000
10 26.818182
11 50.0000002. Median
# Import libraries
import pandas as pd
import numpy as np

# Create the data
data = pd.DataFrame({'Age': [20, 21, 22, 23, 24, 25, 26, 27, 28, 29, np.nan, 50]})
# Print the data with missing value
print("----------------------------------------")
print(f"Here is the data with missing value:\n {data}")

# Calculate the median
median = data['Age'].median()

# Replace the missing values with median
data['Age'] = data['Age'].fillna(median)
print("----------------------------------------")
# Print the data without missing value
print(f"Here is the data without missing value:\n {data}")
----------------------------------------
Here is the data with missing value:
Age
0 20.0
1 21.0
2 22.0
3 23.0
4 24.0
5 25.0
6 26.0
7 27.0
8 28.0
9 29.0
10 NaN
11 50.0
----------------------------------------
Here is the data without missing value:
Age
0 20.0
1 21.0
2 22.0
3 23.0
4 24.0
5 25.0
6 26.0
7 27.0
8 28.0
9 29.0
10 25.0
11 50.0# Import libraries
import pandas as pd
import numpy as np
# Create the data categorical data with mode and missing value
data = pd.DataFrame({'Fruit': ['Apple', 'Banana', 'Apple', 'Banana',
'Apple', 'Banana', 'Apple', 'Banana', 'Apple', 'Banana', np.nan, 'Banana']})
# Print the data with missing value
print("----------------------------------------")
print(f"Here is the data with missing value:\n {data}")
# Find the mode
mode = data['Fruit'].mode()[0]
# Replace the missing values with mode
data['Fruit'] = data['Fruit'].fillna(mode)
print("----------------------------------------")
# Print the data without missing value
print(f"Here is the data without missing value:\n {data}")----------------------------------------
Here is the data with missing value:
Fruit
0 Apple
1 Banana
2 Apple
3 Banana
4 Apple
5 Banana
6 Apple
7 Banana
8 Apple
9 Banana
10 NaN
11 Banana
----------------------------------------
Here is the data without missing value:
Fruit
0 Apple
1 Banana
2 Apple
3 Banana
4 Apple
5 Banana
6 Apple
7 Banana
8 Apple
9 Banana
10 Banana
11 BananaUse following code to see the steps to fill missing values with forward or backward fill in Python:
1. Forward Fill
# Import libraries
import pandas as pd
import numpy as np

# Create the data
data = pd.DataFrame({'Age': [20, 21, 22, 23, 24, 25, 26, 27, 28, 29, np.nan, 50]})

# Print the data with missing value
print("----------------------------------------")
print(f"Here is the data with missing value:\n {data}")

# Replace the missing values with forward fill
data['Age'] = data['Age'].ffill()
print("----------------------------------------")
# Print the data without missing value
print(f"Here is the data without missing value:\n {data}")
----------------------------------------
Here is the data with missing value:
Age
0 20.0
1 21.0
2 22.0
3 23.0
4 24.0
5 25.0
6 26.0
7 27.0
8 28.0
9 29.0
10 NaN
11 50.0
----------------------------------------
Here is the data without missing value:
Age
0 20.0
1 21.0
2 22.0
3 23.0
4 24.0
5 25.0
6 26.0
7 27.0
8 28.0
9 29.0
10 29.0
11 50.02. Backward Fill
# Import libraries
import pandas as pd
import numpy as np

# Create the data
data = pd.DataFrame({'Age': [20, 21, 22, 23, 24, 25, 26, 27, 28, 29, np.nan, 50]})
# Print the data with missing value
print("----------------------------------------")
print(f"Here is the data with missing value:\n {data}")

# Replace the missing values with backward fill
data['Age'] = data['Age'].bfill()
print("----------------------------------------")
# Print the data without missing value
print(f"Here is the data without missing value:\n {data}")
----------------------------------------
Here is the data with missing value:
Age
0 20.0
1 21.0
2 22.0
3 23.0
4 24.0
5 25.0
6 26.0
7 27.0
8 28.0
9 29.0
10 NaN
11 50.0
----------------------------------------
Here is the data without missing value:
Age
0 20.0
1 21.0
2 22.0
3 23.0
4 24.0
5 25.0
6 26.0
7 27.0
8 28.0
9 29.0
10 50.0
11 50.0Use following code to see the steps to fill missing values with KNN imputation in Python:
# Import libraries
import pandas as pd
import numpy as np
from sklearn.impute import KNNImputer

# Create the data
data = pd.DataFrame({'Age': [20, 21, 22, 23, 24, 25, 26, 27, 28, 29, np.nan, 50]})
# Print the data with missing value
print("----------------------------------------")
print(f"Here is the data with missing value:\n {data}")

# Initialize the KNNImputer
imputer = KNNImputer(n_neighbors=2)

# Replace the missing values with KNN imputation
data['Age'] = imputer.fit_transform(data[['Age']])
print("----------------------------------------")
# Print the data without missing value
print(f"Here is the data without missing value:\n {data}")
----------------------------------------
Here is the data with missing value:
Age
0 20.0
1 21.0
2 22.0
3 23.0
4 24.0
5 25.0
6 26.0
7 27.0
8 28.0
9 29.0
10 NaN
11 50.0
----------------------------------------
Here is the data without missing value:
Age
0 20.000000
1 21.000000
2 22.000000
3 23.000000
4 24.000000
5 25.000000
6 26.000000
7 27.000000
8 28.000000
9 29.000000
10 26.818182
11 50.000000Use following code to see the steps to fill missing values with deep learning techniques in Python:
# Import libraries
import pandas as pd
import numpy as np
from sklearn.experimental import enable_iterative_imputer
from sklearn.impute import IterativeImputer

# Create the data
data = pd.DataFrame({'Age': [20, 21, 22, 23, 24, 25, 26, 27, 28, 29, np.nan, 50]})
# Print the data with missing value
print("----------------------------------------")
print(f"Here is the data with missing value:\n {data}")

# Initialize the IterativeImputer
imputer = IterativeImputer()

# Replace the missing values with deep learning techniques
data['Age'] = imputer.fit_transform(data[['Age']])
print("----------------------------------------")
# Print the data without missing value
print(f"Here is the data without missing value:\n {data}")
----------------------------------------
Here is the data with missing value:
Age
0 20.0
1 21.0
2 22.0
3 23.0
4 24.0
5 25.0
6 26.0
7 27.0
8 28.0
9 29.0
10 NaN
11 50.0
----------------------------------------
Here is the data without missing value:
Age
0 20.000000
1 21.000000
2 22.000000
3 23.000000
4 24.000000
5 25.000000
6 26.000000
7 27.000000
8 28.000000
9 29.000000
10 26.818182
11 50.000000Use following code to see the steps to delete missing values in Python:
# Import libraries
import pandas as pd
import numpy as np

# Create the data
data = pd.DataFrame({'Age': [20, 21, 22, 23, 24, 25, 26, 27, 28, 29, np.nan, 50]})
# Print the data with missing value
print("----------------------------------------")
print(f"Here is the data with missing value:\n {data}")

# Delete the rows with missing values
data = data.dropna()
print("----------------------------------------")
# Print the data without missing value
print(f"Here is the data without missing value:\n {data}")
----------------------------------------
Here is the data with missing value:
Age
0 20.0
1 21.0
2 22.0
3 23.0
4 24.0
5 25.0
6 26.0
7 27.0
8 28.0
9 29.0
10 NaN
11 50.0
----------------------------------------
Here is the data without missing value:
Age
0 20.0
1 21.0
2 22.0
3 23.0
4 24.0
5 25.0
6 26.0
7 27.0
8 28.0
9 29.0
11 50.0Bachoo Jee! phir tu hargiz model acha kaam nahi kare ga, yehi nahi abhi or suneay!
Agar hum missing values ko nazar andaaz kar dein toh humein kai masail ka samna karna par sakta hai. Yahan kuch masail hain jo arise ho sakti hain:
📉 Model Accuracy Mein Kami: Machine learning models ki accuracy kam ho sakti hai, kyun ke model ko complete information nahi milti.
📊 Ghalat Analysis: Data analysis mein ghalat nataij nikal sakte hain, jo ke decisions par negative asar dal sakta hai.
😕 Model Confusion: Kuch models missing values handle nahi kar pate, jis se model train nahi ho pata ya phir ghalat predictions karta hai.
🤖 Bias in Model: Missing values ki wajah se model mein bias aane ka khatra barh jata hai.
📚 Data ka Ghalat Interpretation: Missing values ki wajah se humare paas adhoori ya ghalat malumat ho sakti hai, jis ki wajah se hum data ko ghalat tareeqe se interpret kar sakte hain.
💾 Storage Issues: Agar missing values ko replace nahi kiya jaye toh storage mein bhi masail ho sakti hain, kyun ke kuch systems missing values ko store nahi kar pate.
🔀 Data Integration Masail: Different sources se aane wale data mein agar missing values hain toh integration mein masail ho sakti hain.
🚫 Features ka Ghalat Selection: Missing values ki presence mein, kuch aham features ko ignore kiya ja sakta hai jin ka model par asar hona chahiye.
🧪 Ghalat Experimental Results: Science ya research projects mein, missing values ki wajah se ghalat experimental nataij aa sakte hain.
😰 Stress aur Extra Kaam: Data scientists ko extra kaam karna par sakta hai tajziyat mein, kyun ke missing values ko identify aur handle karna parta hai.
Is liye, missing values ko handle karna bohat zaroori hota hai ta ke hum upar diye gaye masail se bach saken. 🛠️🔧🔍
Missing Values - Ek Badi Challenge Lekin Ek Behtareen Mauqa Bhi 🌟Missing values se guzarne ka tajurba har data scientist ke liye ek challenge toh hai hi, lekin isse humein yeh bhi seekhne ko milta hai ke hum kaise data ki mayari ko behtar bana sakte hain. Aakhir mein, behtar quality wale data se hi behtar aur zaheen insights aur models tayyar hoti hain.
Outliers aur Missing values ko handle karne ke liye ye complete masterclass dekhein:
Master Data Preprocessing, Wrangling, and Cleaning for Machine Learning Projects!
Is course mein aap seekhenge:
Main umeed karta hun k ap ko ye chapter ne bht kuch seekhaya ho ga, or agar sach main seekhaya hy then please do support us by sharing this book with your friends and colleagues. Also, do share your feedback with us, so that we can improve our work in future.
![]()
![]()
![]()
![]()
![]()
![]()