Code
import matplotlib.pyplot as plt
from matplotlib_venn import venn2

plt.figure(figsize=(4, 4))
venn2(subsets = (10, 5, 2), set_labels = ('A', 'B'))
plt.show()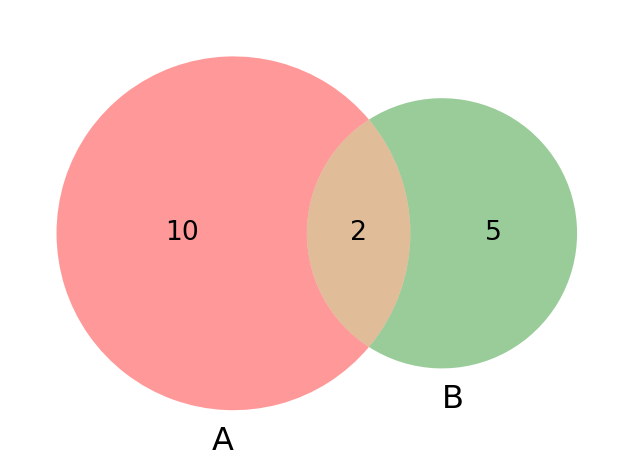
Probability in Statistics (Imkanaat in Shumariyat) 🎲📈
Probability, ya Imkanaat, statistics mein ek bunyadi aur ahem concept hai jo ke kisi event ke hone ki likelihood ya chances ko measure karta hai.
Theoretical Probability (Nazari Imkanaat): Ye woh probability hoti hai jo theory ya basic principles par mabni hoti hai. Jaise, sikke ki misal mein heads ya tails aane ka theoretical probability hamesha 0.5 hota hai.
Experimental Probability (Tajurbaati Imkanaat): Ye woh probability hoti hai jo actual experiments ya observations se calculate ki jati hai. Jaise, agar aap 100 dafa sikka uchhalte hain aur 60 dafa heads aata hai, to heads aane ki experimental probability 0.6 ho jayegi.
Subjective Probability (Subjective Imkanaat): Ye individual judgment ya anubhav par based hoti hai. Jaise, kisi doctor ka ye kehna ke kisi mareez ko kisi bimari hone ki kitni probability hai, based on unke past experiences.
Probability, statistics ka woh hissa hai jo humein uncertain events aur outcomes ko quantify karne mein madad karta hai. Is ke zariye, hum risk assessment karte hain, predictions karte hain, aur complex data sets ko better samajh sakte hain. Ye statistical analysis ka aham juz hai aur is ka istemal kai different fields mein hota hai, jaise finance, engineering, science, aur social sciences.
Let’s explore a real-life example of probability and understand how to calculate it. I’ll present this in an engaging and informative style:
Example: Weather Forecasting (Mausam ki Peshgoi)
Imagine you’re a meteorologist trying to predict the probability of rain tomorrow in your city. Based on historical weather data, you know that in your city, out of 365 days, it typically rains on 100 days.
Probability calculations like this are used every day in weather forecasting. By analyzing historical weather data, meteorologists can predict future weather patterns and provide valuable information to the public and various industries. Similarly, probability is used in many other fields like finance for risk assessment, in healthcare for disease prediction, and in sports for game strategy.
Calculating and understanding probabilities helps in making informed decisions based on statistical evidence rather than guesswork or intuition. This is crucial in fields where decisions can have significant consequences.
import matplotlib.pyplot as plt
from matplotlib_venn import venn2
plt.figure(figsize=(4, 4))
venn2(subsets = (10, 5, 2), set_labels = ('A', 'B'))
plt.show()import matplotlib.pyplot as plt
from matplotlib_venn import venn2
# Define the sets
set_A = {1, 2, 3}
set_B = {3, 4, 5}
# Create subplots
fig, axs = plt.subplots(2, 2, figsize=(5, 5))
# Function to set irrelevant parts to grey
def set_grey(venn, relevant_ids):
all_ids = ['10', '01', '11']
for region in all_ids:
if region not in relevant_ids:
venn.get_patch_by_id(region).set_color('grey')
venn.get_patch_by_id(region).set_alpha(0.3)
# Union of A and B
v = venn2([set_A, set_B], ('A', 'B'), ax=axs[0, 0])
axs[0, 0].set_title("A Union B")
for region in ['10', '01', '11']:
v.get_patch_by_id(region).set_color('green')
v.get_patch_by_id(region).set_alpha(0.5)
# Intersection of A and B
v = venn2([set_A, set_B], ('A', 'B'), ax=axs[0, 1])
axs[0, 1].set_title("A Intersection B")
v.get_patch_by_id('11').set_color('green')
v.get_patch_by_id('11').set_alpha(0.5)
set_grey(v, ['11'])
# Difference A - B
v = venn2([set_A, set_B], ('A', 'B'), ax=axs[1, 0])
axs[1, 0].set_title("A - B")
v.get_patch_by_id('10').set_color('green')
v.get_patch_by_id('10').set_alpha(0.5)
set_grey(v, ['10'])
# Symmetric Difference
v = venn2([set_A, set_B], ('A', 'B'), ax=axs[1, 1])
axs[1, 1].set_title("A Symmetric Difference B")
for region in ['10', '01']:
v.get_patch_by_id(region).set_color('green')
v.get_patch_by_id(region).set_alpha(0.5)
set_grey(v, ['10', '01'])
# Adjust layout and display the plot
plt.tight_layout()
plt.show()
import matplotlib.pyplot as plt
from matplotlib_venn import venn2


# Define the universal set U and set A
set_U = {1, 2, 3, 4, 5, 6, 7, 8, 9, 10}
set_A = {1, 2, 3}

# A Complement (in the context of universal set U)
set_A_compliment = set_U - set_A

# Calculate sizes for the Venn diagram
size_A = len(set_A)
size_U_minus_A = len(set_U - set_A)
size_intersection = len(set_U.intersection(set_A))

# Create a Venn diagram
plt.figure(figsize=(3, 3))
v = venn2(subsets=(size_A, size_U_minus_A, size_intersection), set_labels=('A', 'U'))

# Color A and its complement differently
v.get_patch_by_id('10').set_color('green')  # A
v.get_patch_by_id('01').set_color('red')   # A complement
v.get_patch_by_id('10').set_alpha(0.5)
v.get_patch_by_id('01').set_alpha(0.5)

plt.title("A Compliment in Universal Set U")
plt.show()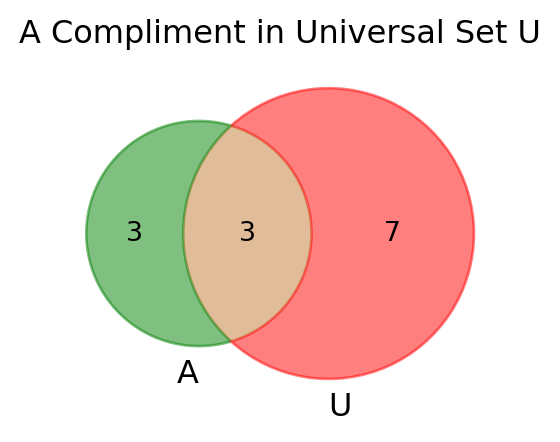
There are several technical ways to define probability, but a definition useful for statistics is that probability tells us how often something is likely to occur when an experiment is repeated.
Probability humein batati hai ke koi cheez kitni baar ho sakti hai jab koi experiment repeat kiya jata hai. Masalan, ye kehna ke sikke ka toss karne par ‘heads’ aane ka probability kitna hai, isey hum sikke ko bohot baar uchaal kar dekh sakte hain aur note karte hain ke kitni dafa ‘heads’ aaya hai. Probability ke baare mein shayad sab se important baat yeh hai: Kisi bhi event ka probability hamesha 0 aur 1 ke darmiyan hota hai. Agar kisi event ka probability 0 hai, toh iska matlab hai ke uska hone ka koi chance nahi hai, jabke agar kisi event ka probability 1 hai, toh yeh zaroor hone wala hai. Mathematics mein probability ko decimals mein specify karna conventional hai, isliye hum kehte hain ke kisi event ka probability 0 aur 1 ke beech hota hai, lekin percentages mein baat karna bhi acceptable hai (aur rozmarra ki baat-cheet mein zyada common hai), toh yeh bhi bilkul theek hai ke kisi event ka probability hamesha 0% aur 100% ke beech hota hai. Decimals se percent mein jaane ke liye, 100 se multiply karen (per cent = har 100 mein se), toh 0.4 probability bhi 40% probability hai (0.4 × 100 = 40), aur 0.85 probability ko bhi 85% probability ke taur par keh sakte hain. Negative probability aur 100% se zyada ki probabilities logical impossibilities hain jo sirf baat-cheet ke taur par exist karti hain. Probability ka 0 aur 1 ke beech bounded hona mathematical implications rakhta hai jo hum is chapter mein baad mein explore karenge.
This fact also provides a useful check on your calculations. If you come up with a probability lower than 0 or greater than 1, you have certainly made a mistake somewhere along the way. Furthermore, if someone tells you there is a 200% chance that you will make a killing in the stock market if you follow his system, you should probably look for a new investment advisor.
Probability Formula
Probability ka formula ye hai:
\[P(\text{Event}) = \frac{\text{Number of Favorable Outcomes}}{\text{Total Number of Outcomes}}\]
Probability ko express karne ke liye, hum is ka formula use karte hain. Is formula mein, humein total number of outcomes aur number of favorable outcomes ko calculate karna hota hai. Total number of outcomes, ya sample space, humein experiment ko perform karne se pehle hi pata hota hai. Lekin number of favorable outcomes ko calculate karne ke liye, humein experiment ko perform karna hota hai. Is liye, hum probability ko calculate karne ke liye experiment ko perform karte hain. Is ke baad, hum probability ko express karne ke liye is ka formula use karte hain.
Question: Ek fair die ko roll karne par 3 aane ka probability kya hai?
Solution:
Question: Ek standard deck of cards mein se ek card draw karne par ‘king’ card aane ka probability kya hai?
Solution:
Conditional Probability, wo probability hoti hai jisme ek event ke hone ki likelihood ko dosre event ke hone ya na hone ke context mein dekha jata hai.
Conditional probability ka istemal rozmarra ki zindagi ke kayi decisions mein hota hai. Jaise, doctors ye jan’ne ke liye istemal karte hain ke agar koi patient kisi symptom ko show karta hai, to usay koi specific bimari hone ki kitni imkanaat hai. Isi tarah, business analysts market trends aur consumer behavior ko samajhne ke liye conditional probability ka istemal karte hain.
For example, we have a bag with 5 red and 5 blue balls, and we want to find the probability of drawing a red ball again (Event A) given that a red ball has already been drawn (Event B), the calculation is as follows:
After drawing the first red ball, there are now 4 red balls left in a total of 9 balls. So, the conditional probability is calculated as:
\[P(\text{A given B}) = \frac{4}{9} \approx 0.444\]
This means there’s approximately a 44.4% chance of drawing another red ball given that one red ball has already been drawn. Jaisay jaisay zada red baal nikaltay ayen gay probability kam hoti jayegi, kyun ke red balls ki tadaad kam hoti jayegi.
Multiple events ka probability calculate karne ke liye, hamen pata hna chahyeay k event independent hain ya dependent.
Example: Tossing a Coin - Events: Event A = Getting heads, Event B = Getting tails - Mutually Exclusive: These events are mutually exclusive because you can’t get both heads and tails on a single coin toss. - Union: P(A or B) = P(A) + P(B). Since the probability of heads (P(A)) and tails (P(B)) is each 0.5, the union is 0.5 + 0.5 = 1. This means either heads or tails is certain to occur.
Example: Drawing a Card from a Deck - Events: Event A = Drawing a heart, Event B = Drawing a queen - Not Mutually Exclusive: These events are not mutually exclusive as one card (the Queen of Hearts) satisfies both events. - Union: P(A or B) = P(A) + P(B) - P(A and B). The probability of drawing a heart (P(A)) is 1/4, a queen (P(B)) is 1/13, and the Queen of Hearts (P(A and B)) is 1/52. So, P(A or B) = 1/4 + 1/13 - 1/52.
Example: Rolling Two Dice - Events: Event A = First die shows a 6, Event B = Second die shows a 6 - Independent Events: The result of the first die doesn’t affect the second die. - Intersection: P(A and B) = P(A) × P(B). The probability of each die showing a 6 is 1/6, so P(A and B) = 1/6 × 1/6.
Example: Drawing Two Cards Successively Without Replacement - Events: Event A = First card is an ace, Event B = Second card is an ace - Nonindependent Events: The outcome of the first draw influences the second. - Intersection: For P(A and B), first calculate P(A), which is 4/52. Then, given A has occurred, there are now 3 aces left in a deck of 51 cards, so P(B given A) = 3/51. Thus, P(A and B) = P(A) × P(B given A) = 4/52 × 3/51.
Bayes’ Theorem, ya Bayes Ka Usool, probability theory mein ek powerful formula hai jo conditional probabilities (shartia imkaaniyat) ko calculate karta hai.
Bayes’ Theorem was named after Thomas Bayes, an English statistician who lived in the 18th century. It is also known as Bayes’ Rule, Bayes’ Law, or Bayes’ Formula.
Example: Medical Diagnosis - Maan lijiye, aap ek doctor hain aur aapko ye maloom hai ke kisi bimari ka overall prevalence (P(B)) bohot kam hai, lekin aapke patient mein kuch specific symptoms (A) hain. Bayes’ Theorem ki madad se, aap calculate kar sakte hain ke given yeh symptoms, is patient ko woh bimari hone ki kitni probability hai (P(A|B)).
Bayes’ Theorem, probability ke theory mein aik jadeed aur mufeed tool hai. Ye na sirf humein complex data sets ko samajhne mein madad karta hai, balki uncertain situations mein informed decisions lene mein bhi hamari rehnumai karta hai. Ye approach humein prior knowledge aur new evidence dono ko effectively combine karne ki taqat deta hai.
Sensitivity, ya hassasiyat, medical testing mein istemal hone wala ek metric hai jo ye measure karta hai ke kisi test ka disease ko detect karne ki kitni capability hai, especially jab disease present ho.
Specificity, ya tafseelat, ek aur important metric hai jo measure karta hai ke kisi test ka disease na hone par kitni accurately negative result dena ka capability hai.
Ye metric population level par kisi specific bimari ke hone ki overall probability ko represent karta hai.
Sensitivity, specificity, aur population mein disease ki probability ki understanding medical professionals ko accurate diagnosis, treatment planning, aur health policy making mein madad karti hai. Ye metrics na sirf individual patient care mein important hain, balki broader public health initiatives aur disease control strategies ko shape karne mein bhi key role play karte hain.
Probability aur Bayes’ Theorem jo is chapter mein discuss kiye gaye, unko mazeed detail mein seekhne ke liye:
Statistics for Data Analytics and Data Science Complete Crash course for beginners in urdu/hindi (14+ hours)
Is video mein aap seekhenge: - Probability Rules and Distributions - Bayes’ Theorem applications - Conditional Probability real-life examples - Data Science mein probability ka kirdar
Main umeed karta hun k ap ko ye chapter ne bht kuch seekhaya ho ga, or agar sach main seekhaya hy then please do support us by sharing this book with your friends and colleagues. Also, do share your feedback with us, so that we can improve our work in future.
![]()
![]()
![]()
![]()
![]()
![]()