
Outliers in a dataset are observations that differ considerably from the rest of the data. Outliers must be identified and handled in any data science project since they can have a substantial influence on numerous statistical approaches, such as means, standard deviations, and so on, as well as the performance of ML models. Outliers can occasionally reveal data flaws or anomalies.
In the jungle of data analysis and machine learning, there’s a fascinating mystery to unravel – outliers. These are data points that stand out, and they could hold valuable insights to help you understand your data better. But what exactly are outliers, and why should you care about them? How do you use them to your advantage?
What are outliers?
Outliers are observations or data points in statistics that differ considerably from the rest of the observations or data points in a dataset. Outliers are unusually high or low values in a feature or dataset. For instance, suppose you have a dataset with a feature height. The bulk of the values in this feature are between 4.5-6.5 feet, however one is 10 feet. This figure is an outlier since it is not just an extreme value but also an unachievable height.

Imagine you have a bunch of marbles, and one of them looks different from the rest. Outliers are like those unique marbles – they don’t fit in with the others. They can be there for various reasons, like measurement errors or unusual events, but they might also reveal important information hidden in your data.
Other names of Outliers:
Outliers are also known as aberrations, anomalous points, abnormalities, and so on. Outliers in a dataset must be detected and handled carefully since they can have a substantial influence on numerous statistical approaches, such as mean, variance, and so on, as well as the performance of ML models. If not appropriately accounted for, it can lead to misleading, inconsistent, and erroneous outcomes.
Types of Outliers
Outliers come in different forms, and each type has its own story to tell:
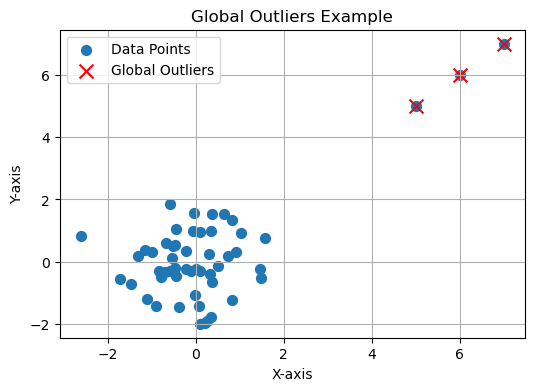
- Global Outliers: Think of a group of animals where one doesn’t belong. It’s a data point that’s significantly different from the others – a global outlier.
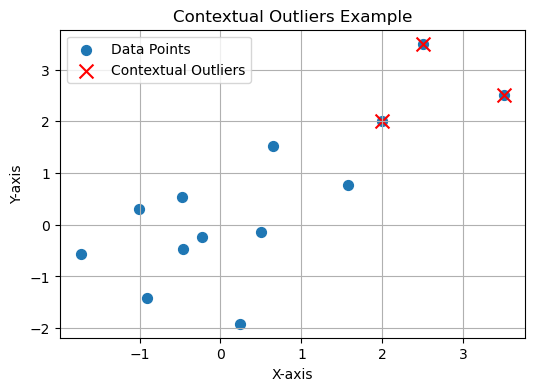
- Contextual Outliers: These are like characters in a story. They only stand out in certain situations, showing their uniqueness at specific moments.
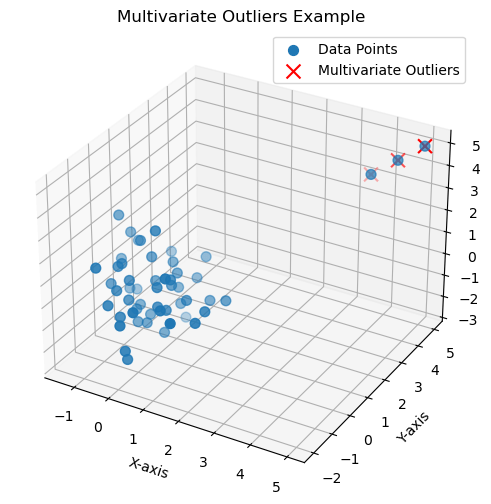
- Multivariate Outliers: These are the chameleons of data, not standing out in just one way, but in multiple ways. You’ll only notice their oddness when you look at them from different angles.
Causes of Outliers
- Data Entry Errors: Human errors such as errors caused during data collection, recording, or entry can cause outliers in data.
- Measurement Error: It can be a result of faulty equipment or the result of experimenter error.
- Experimental Error: For example, in a controlled environment, an unforeseen factor might disrupt an experiment leading to anomalous results.
- Intentional Outlier: These are sometimes introduced to test detection methods.
- Sampling Errors: For instance, during sample collection or extraction, certain unusual samples might be picked.
- Natural Outlier: They don’t necessarily represent any anomaly. For instance, in a class of students, one student may genuinely be extraordinarily tall or short.
Why should we care about outliers?
So, why should you care about outliers? These unconventional data points matter for several compelling reasons:
- Hidden Clues: Outliers often whisper important clues. They could be hints of hidden patterns that could change the way you understand your data.
- Quality Check: Outliers can signal data quality issues. Are they real anomalies, or are they just mistakes in how the data was collected?
- Real-World Impact: In fields like fraud detection, finance, and healthcare, outliers often represent real-world events that need your attention.
Detecting Outliers
- Visualization tools: Box plots, scatter plots, and histograms can be used to spot outliers.
- Statistical Tests: The Z-score or IQR (Interquartile Range) and Percentile Methods can be used to identify outliers.
- Machine Learning algorithms: There are algorithms like DBSCAN and Isolation Forest that can be used to detect outliers.
Now, let’s explore how to find these unusual data points.
The Z-Score Method
Imagine the Z-score as your detective tool. It helps you figure out how different a data point is from the average – a direct sign of its uniqueness.
# Install libraries
pip install numpy
pip install scipy
# Import librariesimport numpy as np
from scipy import stats

# Sample data
data = [2.5, 2.7, 2.8, 3.0, 3.2, 3.4, 3.6, 3.8, 4.0, 100.0]

# Calculate the Z-score for each data point
z_scores = np.abs(stats.zscore(data))

# Set a threshold for identifying outliers
threshold = 2.5# Find outliers
outliers = np.where(z_scores > threshold)[0]

print("Indices of Outliers:", outliers)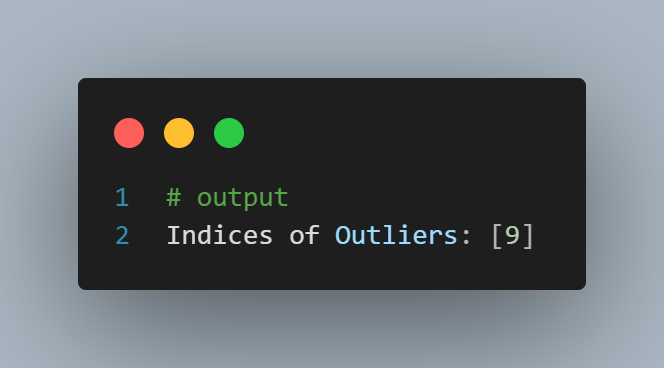
IQR (Interquartile Range) – Data Detective Work
Think of the Interquartile Range (IQR) as your data detective. It identifies outliers by looking at the range between the first and third quartiles, making unusual data points stand out.
# Install library
pip install numpy
# Import libraryimport numpy as np

# Sample data
data = [10, 15, 20, 25, 30, 35, 40, 45, 50, 100]

# Calculate the IQR
q1, q3 = np.percentile(data, [25, 75])
iqr = q3 - q1

# Set a threshold for identifying outliers
threshold = 1.5# Find outliers
outliers = [x for x in data if (q1 - threshold * iqr) > x > (q3 + threshold * iqr)]

print("Outliers:", outliers)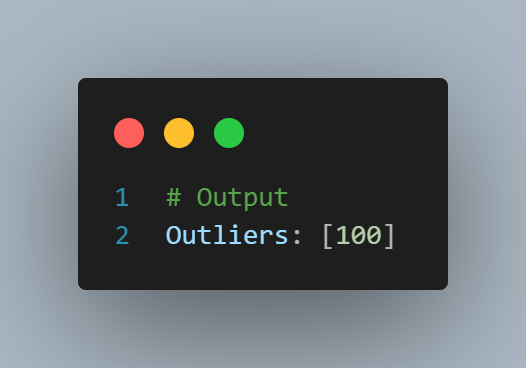
Clustering (K-means)
Clustering techniques like K-means can be used to identify outliers by grouping data points into clusters. Outliers belong to clusters with very few data points.
# Install library
pip install scikit-learn
# Import libraryfrom sklearn.cluster import KMeans

# Sample data
data = [[2, 2], [3, 3], [3, 4], [30, 30], [31, 31], [32, 32]]

# Create a K-means model with two clusters (normal and outlier)
kmeans = KMeans(n_clusters=2)
kmeans.fit(data)

# Predict cluster labels
labels = kmeans.predict(data)

# Identify outliers based on cluster labels
outliers = [data[i] for i, label inenumerate(labels) if label == 1]

print("Outliers:", outliers)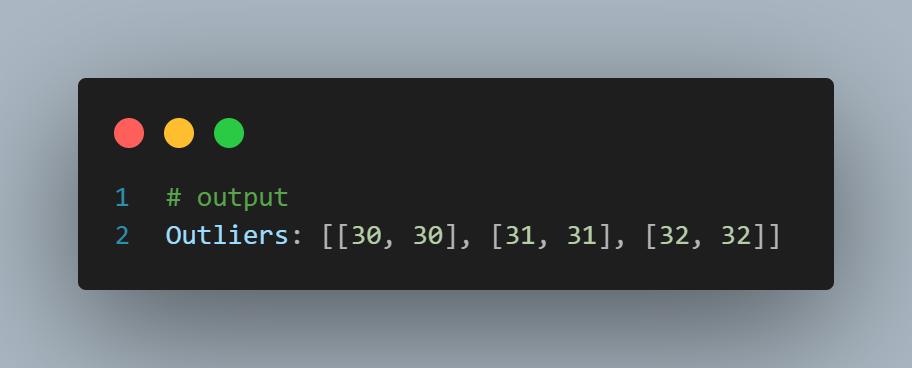
Machine Learning Algorithms (Isolation Forest)
The Isolation Forest is an algorithm specifically designed for anomaly detection. It works by creating isolation trees, where outliers are isolated in shorter trees compared to normal data points.
# Install library
pip install scikit-learn
# Import library
from sklearn.ensemble import IsolationForest

# Sample data
data = [[2], [3], [4], [30], [31], [32]]

# Create an Isolation Forest model
clf = IsolationForest(contamination=0.2)

# Fit the model
clf.fit(data)

# Predict outliers
outliers = [data[i] for i, pred in enumerate(clf.predict(data)) if pred == -1]

print("Outliers:", outliers)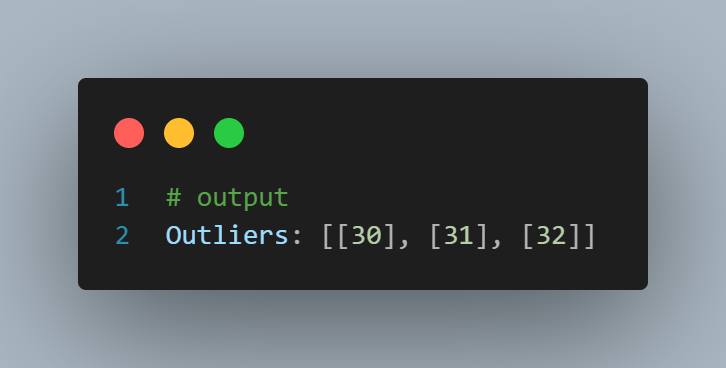
Handling Outliers
- Removing the outlier: This is the most common method where all detected outliers are removed from the dataset.
- Transforming and binning values: Outliers can be transformed to bring them within a range. Techniques like log transformation or square root transformation can be used.
- Imputation: Outliers can also be replaced with mean, median, or mode values.
- Separate treatment: In some use-cases, it’s beneficial to treat outliers separately rather than removing or imputing them.
- Robus Statistical Methods: Some of the statistical methods to analyze and model the data are less sensitive to outliers and provide more accurate results in the data.
Once you’ve found these unusual data points, what should you do with them?

1. Removing Outliers – Cutting Losse Ends
Removing outliers is like tidying up your dataset. If they don’t belong in the story you’re telling, consider leaving them out.
# Sample data
data = [2, 3, 4, 30, 31, 32]

# Set a threshold for identifying outliers
threshold = 5# Remove outliers
data_no_outliers = [x for x if x <= threshold]

print("Data without outliers:", data_no_outliers)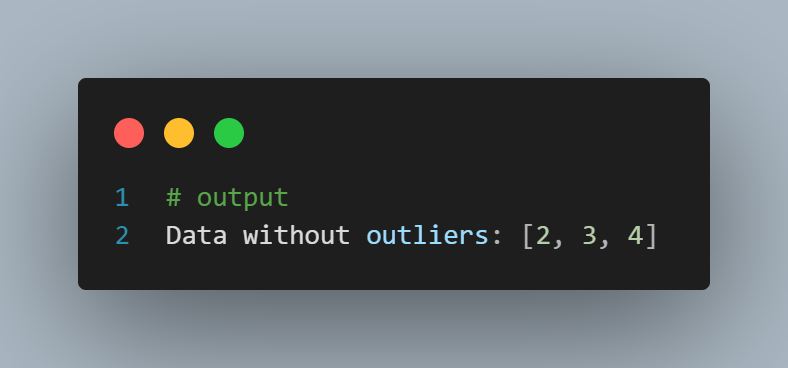
2. Data Transformation – Changing the Shape
Data transformation is like giving your data a new shape. By applying techniques like logarithmic transformation, you can make your data easier to understand.
# Install linrary
pip install numpy
# Import numpyimport numpy as np

# Sample data
data = [2, 3, 4, 30, 31, 32]

# Apply a logarithmic transformation to mitigate the impact of outliers
data_transformed = [np.log(x) for x in data]

print("Transformed data:", data_transformed)
Imputation – Data Resurrection
Imputation involves replacing outlier values with more representative values, such as the mean or median of the non-outlier data points.
# Install numpy
pip install numpy
# Import numpyimport numpy as np

# Sample data
data = [2, 3, 4, 30, 31, 32]

# Set a threshold for identifying outliers
threshold = 5# Replace outliers with the median value
median = np.median(data)
data_imputed = [x if x <= threshold else median for x in data]

print"Imputed data:", data_imputed
Outliers in Real-World Applications
Outliers are pervasive in various industries:
Finance
In financial analysis, outliers can indicate market anomalies or financial irregularities.
Healthcare
Outliers in healthcare data can signify rare diseases or extreme patient outcomes.
Environmental Monitoring
Anomalies in environmental data can point to unusual events, like natural disasters.
Best Practices for Handling Outliers
To effectively manage outliers in your machine learning projects, consider the following best practices:
Understand the Domain
Familiarize yourself with the domain you’re working in to distinguish meaningful outliers from noise.
Use Multiple Techniques
Combine outlier detection methods to ensure robust results.
Consider Impact
Evaluate the impact of different outlier treatment methods on your specific problem and dataset.
Document Your Process
Keep a clear record of how you handle outliers for transparency and reproducibility.
Conclusion
- Outliers in a dataset are observations that deviate dramatically from the rest of the data points. They might arise as a result of data gathering mistakes or abnormalities, or they can be real findings that are just infrequent or extraordinary.
- If outliers are not appropriately accounted for, they might produce misleading, inconsistent, and erroneous findings. As a result, identifying and dealing with outliers is critical in order to produce accurate and useful data analysis findings.
- Outliers may be detected using a variety of methods, including the percentile approach, IQR method, and z-score method. Outliers can be dealt with in a variety of methods, including removal, transformation, imputation, and so on.
As you venture further into the world of data, don’t shy away from outliers. They are the remarkable characters of your dataset, each with a unique story to share. Embrace your curiosity and let the secrets hidden in your data come to light. Understanding the mysteries of outliers is not just a science; it’s an art.
If you want to learn Exploratory Data Analysis and Data Wrnagling, explore our blog:
Our Free Curses:
If you are a urdu/Hindi speaker you can explore our free courses here.
Our Most impirtan ongoing course is:
- Six months of AI and Data Science Mentorship Program (this course will teach you everything abuot Data Science and AI, free of cost.
done
done
that’s good it is it not in roman urdu
asslam o allkam Sir, thanks now we get blogpost with code
Outliers are mostly handled by percentile (IQR) or Z-score method which is a better way to avoid substantial influence on a dataset for transforming it into an ML model.
Outliers very well explained – Thanks Dr.Ammar
All the way great blog, it awesome
good explain sir
Thanks for blog in simple English. Videos, codes and blog making strong base and easy conceptual understanding of topics, especially for beginners, Ma Sha Allah.
Excellent explanation about Outliers.
Thank a lot
Very Well Explain ❤️ ..
All the way gr8 blog, it awesome
Awesome Sir g
is blog mn outliers kai barai mn btaya gya hai kai outliers are those datapoints that are different from the rest of data set they can disrupt the whole data they cause disruption in machine learning model , mean, varience ,standered deviation etc they can be detected by the v visual method and the statistical method the visual method includes the boxplot and scatterplot while the statistical method include the zscore and iqr these outliers can disrupt the whole data