
When diving into the world of data analysis, one can hardly overlook the powerful Pandas library in Python to do EDA (Exploratory Data Analysis). Especially in the realm of Exploratory Data Analysis (EDA), Pandas has proven to be an indispensable tool. In this article, we’ll explore how to effectively leverage this library for EDA analysis.
What is EDA?
Exploratory Data Analysis (EDA) is an approach to analyzing datasets, often to summarize their main characteristics, using visual methods. Before applying machine learning models or statistical techniques, EDA helps data analysts and scientists to understand the data, its patterns, and any anomalies that may exist.
Pandas for EDA: An Overview
One of the first steps in EDA is loading and inspecting data. Pandas provides functionalities to read data from a variety of sources, including CSV, Excel, SQL databases, and more. Once loaded, you can use methods like head(), describe(), and info() to get a quick overview of the dataset.
Steps in EDA Using Pandas
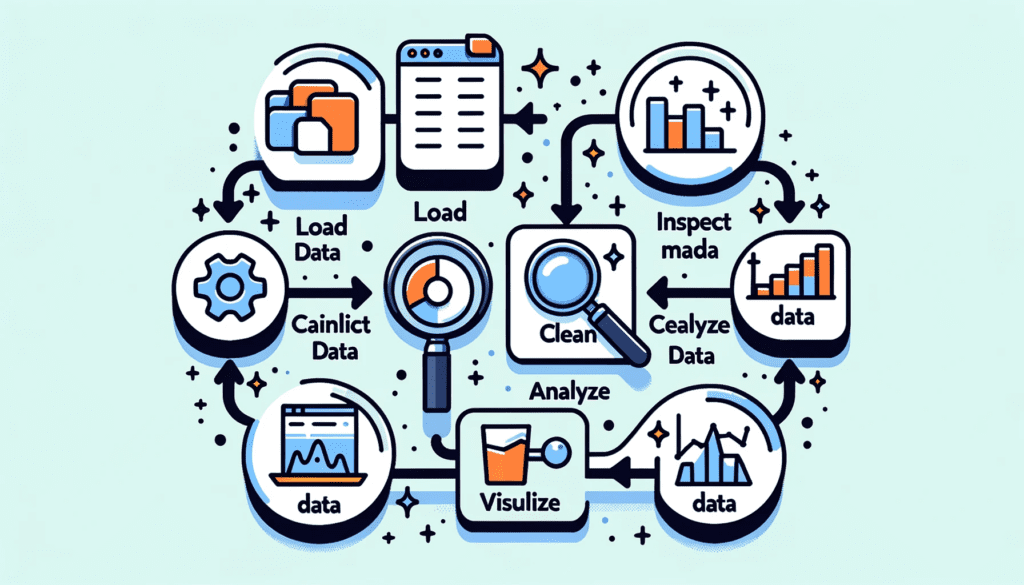
- Load Data: Use functions like
read_csv(),read_excel()to load your data into a Pandas DataFrame. - Inspect Data: Methods such as
head(),tail(), andinfo()give a quick snapshot of the data. - Clean Data: Handle missing values, outliers, and duplicate rows. Functions like
dropna(),fillna(), anddrop_duplicates()can be handy. - Analyze Data: Use statistical methods to get insights. Functions like
mean(),median(),std(), andcorr()are useful. - Visualize Data: Create plots to understand the distribution and relationship between variables. Pandas integrates seamlessly with libraries like Matplotlib and Seaborn for this purpose.
Data Visualization with Pandas
Visualization plays a pivotal role in EDA. With Pandas, you can create a variety of plots without the need for any other library. However, for advanced plots, integration with libraries like Matplotlib and Seaborn can be beneficial.

For instance, to visualize the distribution of a particular column, you can use the hist() function. Similarly, to understand the relationship between two variables, scatter plots can be plotted using the plot.scatter() function.
Fun with Pandas!
Lastly, while Pandas is a powerful tool for data analysis, it also has a fun side! Just think of the library’s name, inspired by the term “panel data”. And who can resist a cute panda analyzing data?
In conclusion, the Pandas library in Python offers a plethora of functionalities that make EDA a breeze. From loading data to visualization, Pandas has got you covered. So, the next time you’re about to embark on a data analysis journey, ensure you have Pandas by your side!
Resources to learn Python pandas for EDA
Read more about Mastering pandas in Hindi/Urdu or you can also read a Desi guide to EDA
Or there is a very nice blog on EDA using Python.
Give a read to this very nice book updated in 2023: Python for Data Analysis, 3E.
Youtube Lectures on Pandas in Urdu/Hindi
Good Luck and Keep Learning!
This guide is very useful for understanding EDA.
Thank you for making the effort.
its amazing sir
very nice sir and thanks for the valuable information.
excited to complete this journey with you dear sir,
Great baba g
Your data science teaching journey is great for coder and non coder to help them switch there careers
BaBa G the great, The Gem
Inspirational blog about the EDA
very beneficial blog for beginners
AOA,
The Pandas Python Library for EDA Analysis: A Comprehensive Guide is very helpful for understanding EDA.
Baba g The diamond
EDA using python wala blog owesome hey… great Sir
thanks
Best Ever Explain.
We can load/import from 40 file formats through PANDAS libraries and write/export in 46 file formats.
Pandas are so interesting and it’s fun while coding just because of Sir Ammar, his way of teaching method is directly and clearly understandable
Thanks, Sir
Got 84 %
Amazing article related EDA using pandas library.
WELL EXPLAINED
superb sir g
Superb sir very very………………………..
“Pandas Python Library for EDA Analysis: A Comprehensive Guide” Jazzak Allah Sir for such comprehensive Guide
Nice approach and briefly explained.
thanxxx for sharing such information
Done👍
Thanks