Welcome to the intriguing world of statistics and data science! Today, we’re going to unravel a fundamental concept that stands at the core of statistical analysis – the difference between a population and a sample.
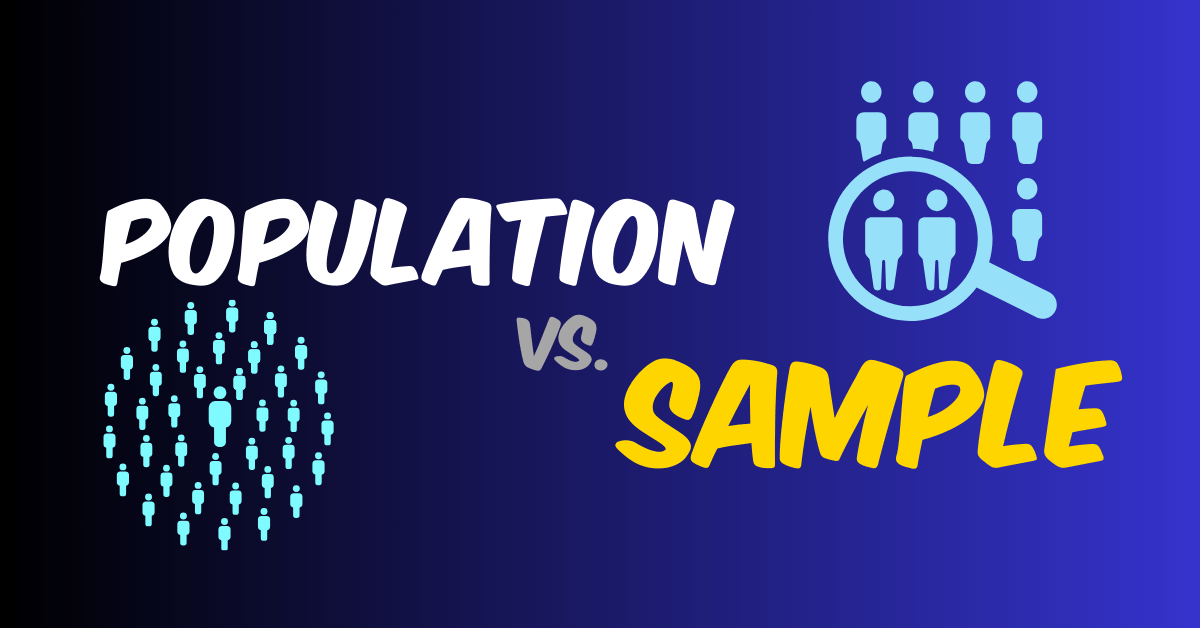
Population vs. Sample in Statistics and Data Science: A Comprehensive Guide 🌍🔍
Understanding this distinction is crucial for anyone venturing into data analysis or research. Let’s dive in and explore why both are essential, and how they differ, complemented by illustrative graphs.
Understanding Population and Sample: The Basics 📚
What is a Population? 🌐
- Definition: In statistics, a population refers to the entire group that you want to draw conclusions about.
- Characteristics: It includes all members of a specified group. For example, the population could be “all the people living in Lahore City” or “every oak tree in a forest.”
- Key Point: Studying an entire population is often impractical or impossible due to its size and accessibility.
What is a Sample? 🔍
- Definition: A sample is a subset of the population, selected for study.
- Characteristics: It’s a smaller group, chosen to represent the population. For instance, surveying 1,000 residents of Lahore City as a sample of the entire city’s population.
- Key Point: The sample should be representative of the population to ensure accurate conclusions.
The Importance of Population and Sample in Statistics 🌟
Population: The Source of Truth 🏛️
- Comprehensive Data: The population holds all possible data points, providing a complete picture.
- Ideal for Analysis: When feasible, analyzing the entire population gives the most accurate results.
- Graphical Representation: Imagine a graph covering every data point of the population. It would show the true distribution, trends, and patterns (e.g., a bar graph representing the age distribution of an entire city).
Sample: The Practical Approach 🎯
- Feasibility and Efficiency: Sampling makes studies feasible, saving time and resources.
- Representativeness: A well-chosen sample can accurately reflect the population.
- Graphical Representation: A graph based on a sample (like a scatter plot of a subset of data points) aims to mirror the pattern found in the entire population, albeit on a smaller scale.
Why Both are Important in Statistics and Data Science? 📈
- Population Analysis: Ideal for complete and accurate data but often unrealistic due to its scale.
- Sample Analysis: More practical and the norm in most studies. It allows us to make inferences about the population based on a manageable amount of data.
- In Data Science: Big data analytics often deals with large portions of populations, making it a blend of population and sample analysis.
Ensuring Accurate Sampling 🎲
- Random Sampling: Ensures every member of the population has an equal chance of being selected.
- Stratified Sampling: Divides the population into strata and samples from each stratum.
- Sample Size: Larger samples generally provide more accurate reflections of the population.
Examples:
Dive into the heart of statistics with these relatable examples from Pakistan! We’ll explore how the concepts of population and sample play out in everyday scenarios, making these statistical terms more tangible and relevant to your world. 🌏✨
Example 1: Health Study in Karachi 🏥
Population
- Context: A study to understand diabetes prevalence in Karachi.
- Population: All adult residents of Karachi.
- Note: Assessing every adult in Karachi would be a Herculean task, given the city’s vast population.
Sample
- Context: A practical approach to the study.
- Sample: 1,000 adults selected randomly from various neighborhoods in Karachi.
- Note: This sample provides a snapshot that helps estimate the diabetes rates for the whole city. 📊
Example 2: Lahore’s Customer Satisfaction Survey 🛍️
Population
- Context: A clothing brand wants to measure customer satisfaction.
- Population: All customers who shopped at their Lahore outlets in the past year.
- Note: Reaching out to every single customer would be like finding a needle in a haystack!
Sample
- Context: A manageable survey approach.
- Sample: 300 customers randomly chosen from their database of Lahore shoppers.
- Note: This smaller group can give the brand valuable insights into customer satisfaction trends. 📝
Example 3: Educational Research in Islamabad 🏫
Population
- Context: Evaluating a new online learning platform.
- Population: All middle school students in Islamabad.
- Note: Implementing and evaluating this platform across all schools in Islamabad is a tall order.
Sample
- Context: Conducting a pilot study.
- Sample: Students from three selected middle schools in different areas of Islamabad.
- Note: The feedback from this sample can illuminate how the platform might perform city-wide. 💡
Example 4: Environmental Study in Faisalabad 🌳
Population
- Context: Monitoring air quality in Faisalabad.
- Population: Air quality readings from every part of Faisalabad.
- Note: Covering the entire city for air quality data would be as challenging as counting every leaf in a forest!
Sample
- Context: A focused study.
- Sample: Air quality monitors installed at 20 strategic locations in Faisalabad.
- Note: These readings offer valuable clues about the city’s overall air quality. 🌬️🌆
Wrapping It Up: The Art of Sampling 🎨📈
In each example, we see how sampling makes big tasks manageable. Whether it’s healthcare in Karachi or environmental research in Faisalabad, using a sample is like using a magnifying glass to focus on the essential details, giving us insights that are practical yet powerful. So next time you think of population and sample, remember these examples from the heart of Pakistan! 🇵🇰💚
Conclusion: Balancing Accuracy and Practicality ⚖️
In statistics and data science, understanding and differentiating between population and sample is fundamental. While population data offers the most accurate insights, practical constraints often make sampling a necessity. By employing robust sampling methods, we can ensure that our sample-based inferences closely approximate the reality of the population.
Remember, the key is in the balance: leveraging the strengths of both population and sample analysis to gather insights that are both accurate and achievable.

LinkedIn Networking Guide for Pakistani AI & Data Science Students | Codanics

Why Learning Bioinformatics is Essential for the Future of Science and Healthcare


NLP Mastery Guide: From Zero to Hero with HuggingFace | Codanics

Scikit-Learn Mastery Guide: Complete Machine Learning in Python


loved this article. The examples section made it a lot easier to understand the whole concept.
as a beginner i must say that these blogs help me a lot to learn effectively
AOA, This blog provides a comprehensive and informative explanation of the distinction between a population and a sample. It effectively highlights the importance of both statistical analysis and data science. The inclusion of relatable examples from Pakistan enhances the understanding of these concepts. It is a well-written and valuable resource for me and anyone interested in statistics. ALLAH PAK ap ko dono jahan ki bhalian aata kry AAMEEN.
keep it up jaza.k.allah and get well soon sir dil se thank you
Very informative blog. The examples mentioned in the blog are not fictitious, these are real time issues for the country.
Amazing and very informative
homework done
I am going through the matter in a printed form. It is convenient for me to read it in printed form and to take notes where necessary Only problem I face is small font. I reserved my observation before and now again that use 12 or 14 point fonts. As 6 or 8 is too small. It would be more convenient , shall we get pdf format to get appropriate font size in pdf writer. Thank you .
you can also scale the font in print to pdf function on chrome, next time I will taks care of this as well
good explanation of the population and sample in an easy way.
nicely written!
Population vs sample ::::
If there is a village consisting of 500 people and we wanna know their favorite tea brand so if we ask to everyone that’s called population and if we ask only random 40 or say 50 people about their choice that called sample data.