Results Section Quiz: Report Statistics, Figures and Tables in APA 7 Style
Check how well you write a results section: keeping results separate from interpretation, formatting t, F, χ², r, p and confidence intervals in APA 7, reporting and interpreting effect sizes, choosing between a figure and a table, designing clear colour-blind safe figures, building APA tables and reporting non-significant results honestly. Built from the Scientific Writing Marathon course.
Results Section & APA Statistics Reporting Quiz
60 questions · 7 topics · timer · instant explanations · printable mark sheet.
- Questions60 in the bank, 10–30 per attempt
- Levels20 easy · 24 medium · 16 hard
- TimeAbout 5–20 minutes
- PriceFree, no login needed
- Made byDr. Aammar Tufail, Codanics
- Updated22 November 2026
In short: the Results Section & APA Statistics Reporting Quiz is a free online multiple-choice quiz by Codanics with 60 questions on results vs interpretation; APA 7 statistics format; effect sizes; figure or table; figure design and colour; APA tables; and non-significant results and consistency. You choose the number of questions and the difficulty, answer against a timer, see an explanation after every answer and finish with a printable mark sheet.
What the Results Section & APA Statistics Reporting Quiz covers
The results section is where reviewers check your numbers. A missing degree of freedom, a p = .000, an effect size left out or a figure that red–green colour-blind readers cannot read all suggest careless work, even when the study itself is sound.
This quiz covers the rules that matter most when you report findings: APA 7 formatting for common tests, effect sizes and confidence intervals, figure and table design, and honest reporting of null results. Each explanation teaches the rule, and weak topics in your mark sheet link to free guides.
- Results vs interpretation 9 questions
- APA 7 statistics format 10 questions
- Effect sizes 9 questions
- Figure or table 6 questions
- Figure design and colour 8 questions
- APA tables 8 questions
- Non-significant results and consistency 10 questions
Who it is for: BS, MS, MPhil and PhD students, early-career researchers and lecturers who are writing up statistical results for a paper, thesis chapter or report.
How the quiz works
- Type your name if you want it printed on the mark sheet (optional; it never leaves your browser).
- Choose 10, 20 or 30 questions, a difficulty (Easy, Mixed or Hard) and the timer: Standard, Relaxed or none.
- Answer each question before the timer runs out. Press A–D or 1–4 on a keyboard, or tap an option on your phone.
- Read the explanation after every answer, then press Next.
- At the end, get your score, grade, topic-wise breakdown and a full answer review. Print it or save it as a PDF.
- Retake the quiz for a fresh random set, or practise only the topics you found hard.
Free video lessons from Codanics
Score lower than you hoped? These free lessons from the Codanics YouTube channel cover the same topics, explained step by step.
Free on the Codanics YouTube channel, taught in Urdu/Hindi.
Sample questions with answers
Here are 10 questions from the bank, with answers and explanations. The quiz above draws from all 60.
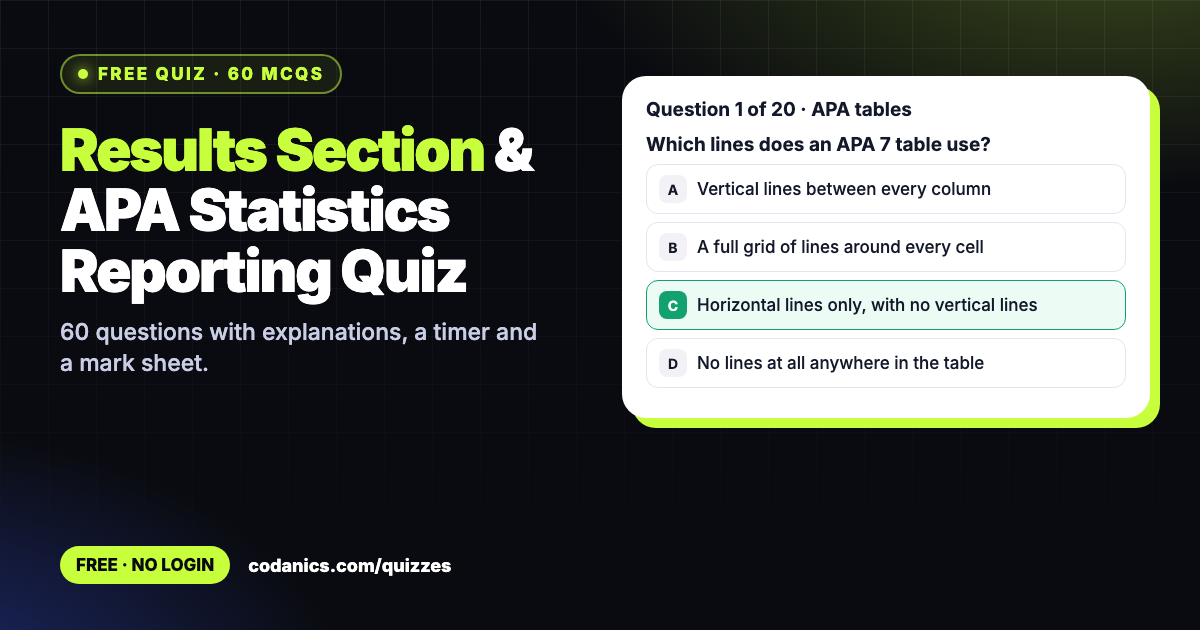
1. Which lines does an APA 7 table use?
- Vertical lines between every column
- A full grid of lines around every cell
- Horizontal lines only, with no vertical lines
- No lines at all anywhere in the table
Answer: C. Horizontal lines only, with no vertical lines
APA tables use a few horizontal rules (above and below the header and at the bottom) and no vertical lines. White space, not grid lines, separates the columns.
2. Which sentence belongs in the results section of a paper?
- This suggests the programme reduced stress at the workplace.
- Mean anxiety scores fell from 24.1 to 18.3 after the programme.
- Future studies should test the programme in other schools.
- Anxiety is a growing problem among university students.
Answer: B. Mean anxiety scores fell from 24.1 to 18.3 after the programme.
Results report what was found, with numbers. Explaining why ("this suggests") and future work belong in the discussion; general background belongs in the introduction.
3. A figure shows bar means with error bars. What must the caption say about them?
- Only the colour used for each group's bars
- Whether the bars show SD, SE or a 95% CI
- Nothing, as readers assume standard error
- The software version used to draw them
Answer: B. Whether the bars show SD, SE or a 95% CI
SD, SE and 95% CI bars look the same but mean very different things; a 95% CI is about twice as wide as the SE. Always state which one is shown and the n per group.
4. Which t-test result is written in correct APA 7 style?
- t = 7.40 (58), p < 0.001
- T(58)=7.40, P<.001
- t58 = 7.40, p = .000
- t(58) = 7.40, p < .001
Answer: D. t(58) = 7.40, p < .001
APA 7 puts the degrees of freedom in brackets after t, uses spaces around =, drops the leading zero for p and never reports p = .000. The symbols t and p are lower case and italic.
5. Which colour pair should you avoid as the only way to tell groups apart in a figure?
- Blue and orange
- Red and green
- Black and light grey
- Dark blue and yellow
Answer: B. Red and green
Red–green colour vision deficiency is the most common type, affecting roughly 1 in 12 men of European descent. Blue–orange pairs remain distinguishable for most readers.
6. Which is the strongest way to point readers to a figure in the results text?
- Figure 1 shows the results of the yield data from the trial.
- The yield results can be seen in the figure that is given below.
- Treated plots out-yielded controls at all three sites (Figure 1).
- Please refer to Figure 1 for the results of the yield analysis.
Answer: C. Treated plots out-yielded controls at all three sites (Figure 1).
State the finding first and cite the figure in brackets. A sentence that only says "Figure 1 shows the results" makes the reader work out the message alone.
7. Zoya's main test gives p = .21. How should she report it?
- Report the exact p, the effect size and its CI
- Leave the result out of the paper entirely
- Write only "n.s." without any numbers
- Say the result "approached significance"
Answer: A. Report the exact p, the effect size and its CI
Non-significant results are reported just like significant ones: exact p, effect size and confidence interval. Hiding them causes publication bias.
8. Which line uses leading zeros correctly in APA 7?
- r(48) = .62 and d = 0.45
- r(48) = 0.62 and d = .45
- r(48) = .62 and d = .45
- r(48) = 0.62 and d = 0.45
Answer: A. r(48) = .62 and d = 0.45
Drop the leading zero only for values that cannot exceed 1, such as r and p. Cohen's d can be larger than 1, so it keeps the zero: d = 0.45.
9. Why should you report an effect size along with the p-value?
- Effect sizes remove the need to report the sample size at all
- Journals use effect sizes to count how often a paper is cited
- A p-value cannot be calculated before an effect size is chosen
- The p-value shows how surprising the data are, not how big the effect is
Answer: D. The p-value shows how surprising the data are, not how big the effect is
A p-value depends heavily on sample size, so a tiny effect can be "significant" in a large study. The effect size (with its CI) tells readers how large and how important the difference is.
10. When is a table usually better than a figure?
- When showing a trend over time
- When readers need the exact values
- When the main message is a pattern
- When comparing two groups visually
Answer: B. When readers need the exact values
Tables suit exact numbers and many variables that readers may look up. Figures suit trends, patterns and visual comparisons where the big picture matters more than each value.
Free guides and blogs to study
Free tools for your studies and research
Codanics also has 160+ free online tools for students and researchers: statistics calculators, meta-analysis, PDF and writing tools. They run in your browser, with no login.
🖋️ All scientific writing tools and quizzes → Reference checker, APA results sentences, writing checklists and more, all free.
Frequently asked questions
Is the Results Section & APA Statistics Reporting Quiz free?
Yes. The Results Section & APA Statistics Reporting Quiz is completely free, with no sign-up, no login and no limit on attempts.
How many questions are in the Results Section & APA Statistics Reporting Quiz?
The question bank has 60 multiple-choice questions (20 easy, 24 medium and 16 hard) across 7 topics. Each attempt draws 10, 20 or 30 of them at random, so every attempt is different.
How does the timer work?
Each question has its own countdown: about 25 seconds for easy, 40 for medium and 55 for hard questions, plus 15 seconds when there is code to read. Choose Relaxed to double the time or switch the timer off to study at your own pace. Unanswered questions count as skipped.
Can I get a certificate or mark sheet?
Yes. When you finish, you get a mark sheet with your name, score, grade, time, topic-wise performance and every answer explained. Use Print or save as PDF to keep it. It is a self-assessment result, not an official certificate.
Are the answers and explanations correct?
Every question was written and reviewed for one clearly correct answer, and code questions were checked by running the code. If you think an answer is wrong, tell us on the Codanics WhatsApp channel or in the YouTube comments and we will fix it.
How do I report a t-test in APA 7 style?
Give the means and SDs, then the test with its degrees of freedom, the exact p-value and an effect size, for example t(58) = 2.45, p = .017, d = 0.63. Italicise t, p and d, put spaces around the equals sign and drop the leading zero for p.
Should I report non-significant results in my paper?
Yes. Report them with the exact p-value, the effect size and its confidence interval, just as you would a significant result. Do not call them a trend or claim they prove no effect; a wide interval simply means the result is uncertain.
Where can I learn to write a full results section step by step?
The Scientific Writing Marathon by Dr. Muhammad Aammar Tufail takes you from a research question to a finished manuscript, including results, figures, tables and APA statistics, with live classes and writing tasks on your own paper. Recorded lectures stay on the LMS so you can learn at your own pace.
Is my data stored anywhere?
No. The quiz runs entirely in your browser. Your name, answers and score are not uploaded. Your best score and settings are remembered only in this browser so you can track your progress.
More free quizzes

See all Codanics quizzes → · Courses · Free tools · Blog
