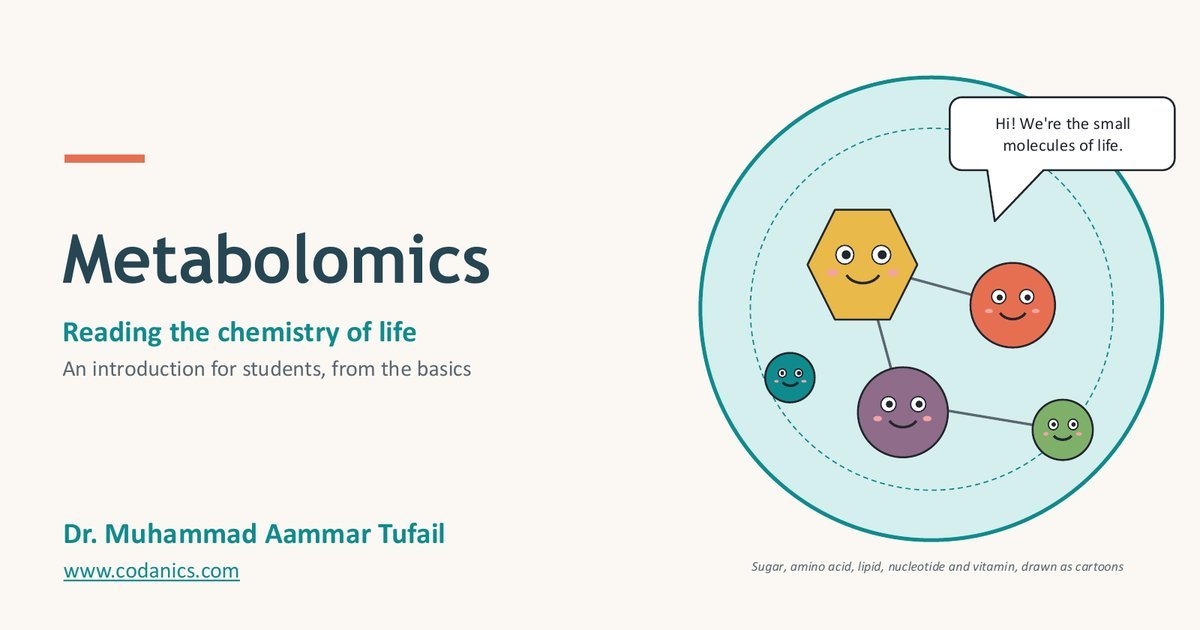
Metabolomics: The Complete Guide, from Basics to Data Analysis
Learn what metabolites are, how a metabolomics study works from sample to biology, how LC-MS, GC-MS and NMR detect small molecules, and how to process, analyse and interpret the data, with slides, infographics, Python code, key papers and a free video course in Urdu/Hindi.
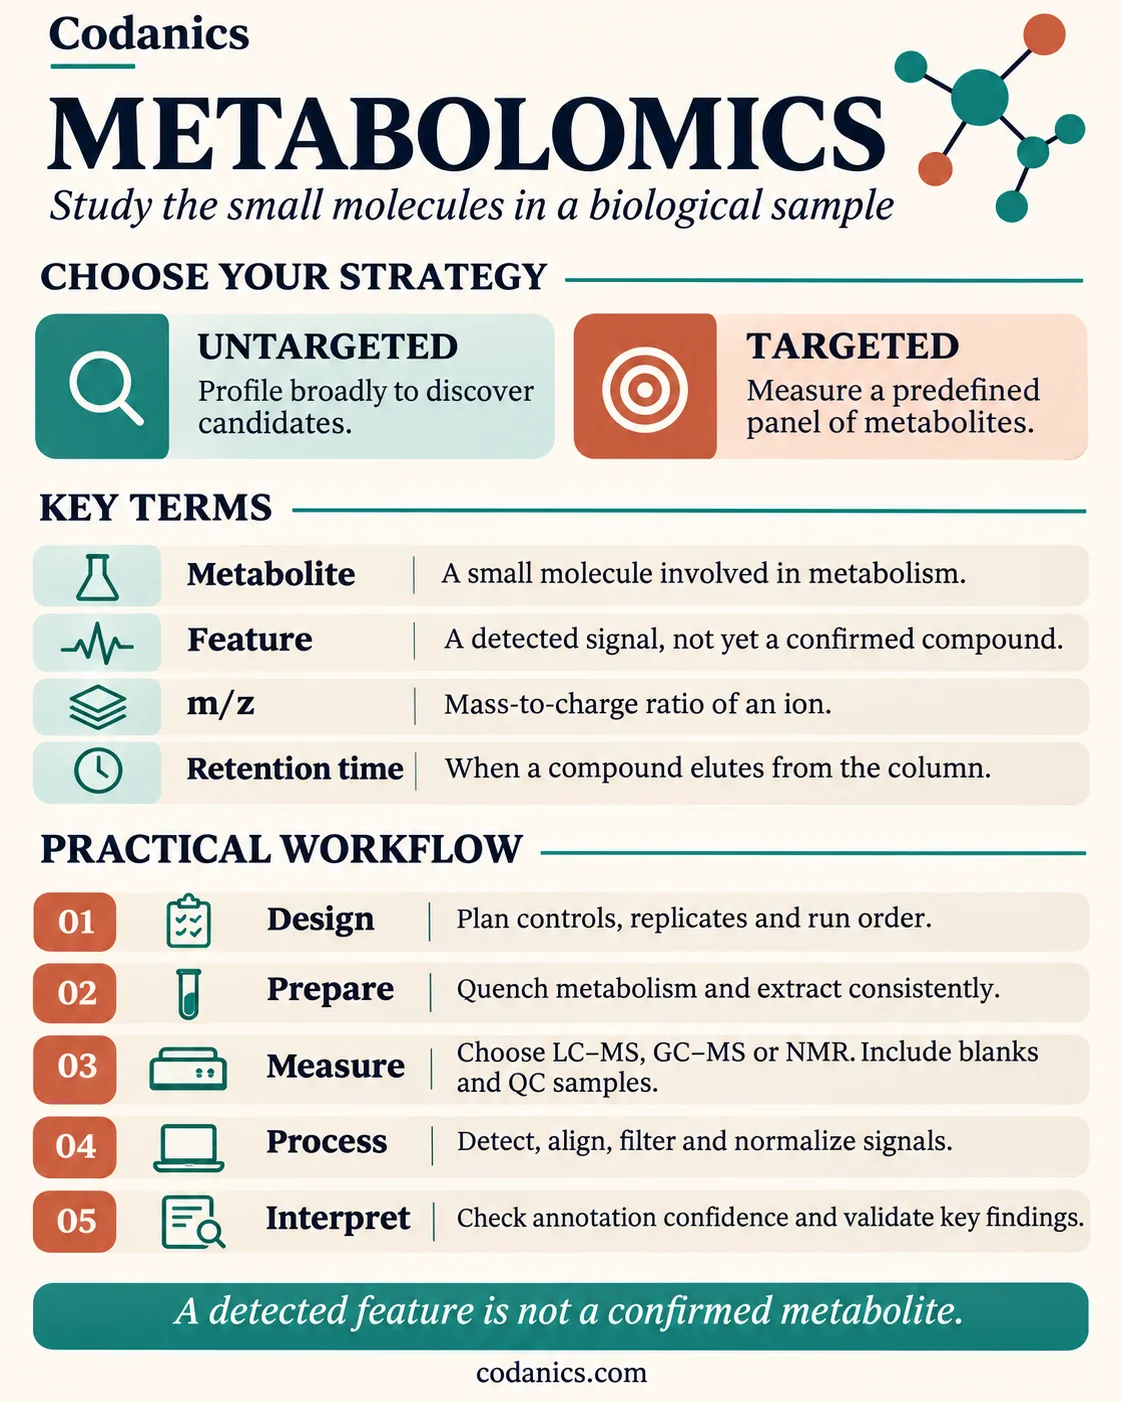
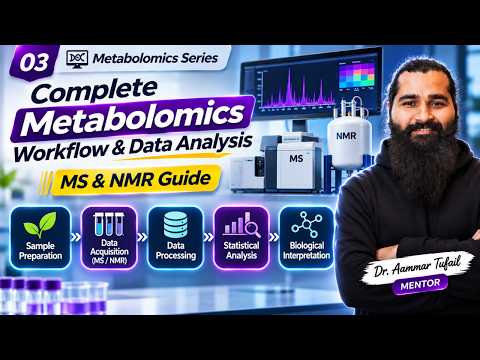
Watch the free video courseMetabolomics reads the chemistry of life. It measures the small molecules (metabolites, usually below 1,500 Da) in a cell, tissue or body fluid, which makes it the omics layer closest to the phenotype. A study follows eight steps: ask a question, design the study, collect and quench samples, extract, measure with LC-MS, GC-MS or NMR, process raw signals into a feature table, run statistics and identify metabolites, and interpret the changes on metabolic pathways. Remember the golden rule: a detected feature is not a confirmed metabolite.
| What it measures | Small molecules: sugars, amino acids, lipids, nucleotides, organic acids, drugs and other xenobiotics |
|---|---|
| Strategies | Untargeted (discover, thousands of signals) and targeted (measure a known panel exactly) |
| Main instruments | LC-MS, GC-MS and NMR spectroscopy |
| Core data | A feature table: samples × features (m/z at a retention time) × intensity |
| Key statistics | PCA, PLS-DA, t-test or Mann–Whitney with FDR correction, volcano plots |
| Free software | MZmine, MS-DIAL, XCMS, MetaboAnalyst, SIRIUS, GNPS, Python and R |
| Golden rule | Report the identification confidence level: a detected feature is not a confirmed metabolite |
- Biology and computing foundations for beginners
- Python and R for biological data
- Omics data analysis, including metabolomics workflows
- Projects, guidance and a community of learners
When I teach metabolomics, I start with a simple picture: genes tell you what could happen, proteins do the work, but metabolites show what is happening right now. A blood sample from someone who just drank coffee, fasted overnight or took paracetamol tells a different chemical story, even though their genome has not changed. That is why metabolomics has become one of the most exciting, and most in-demand, skills in biology, medicine and agriculture.
It is also a field where beginners get lost quickly: m/z, retention time, adducts, features, PQN, PLS-DA, MSI levels. So I built this guide from the slides and infographics I use in class and from my new Metabolomics Complete Course on YouTube. It goes from “what is a metabolite?” all the way to a working Python data-analysis pipeline, in plain English, with every important claim linked to its source.
If you are new to the field, read my article on why learning bioinformatics is essential first, then come back here. If you already work in a lab, jump straight to study design and quality control or statistics.
In this guide
- What is metabolomics? Metabolites and the metabolome
- A short history and the growing metabolome
- Targeted vs untargeted metabolomics
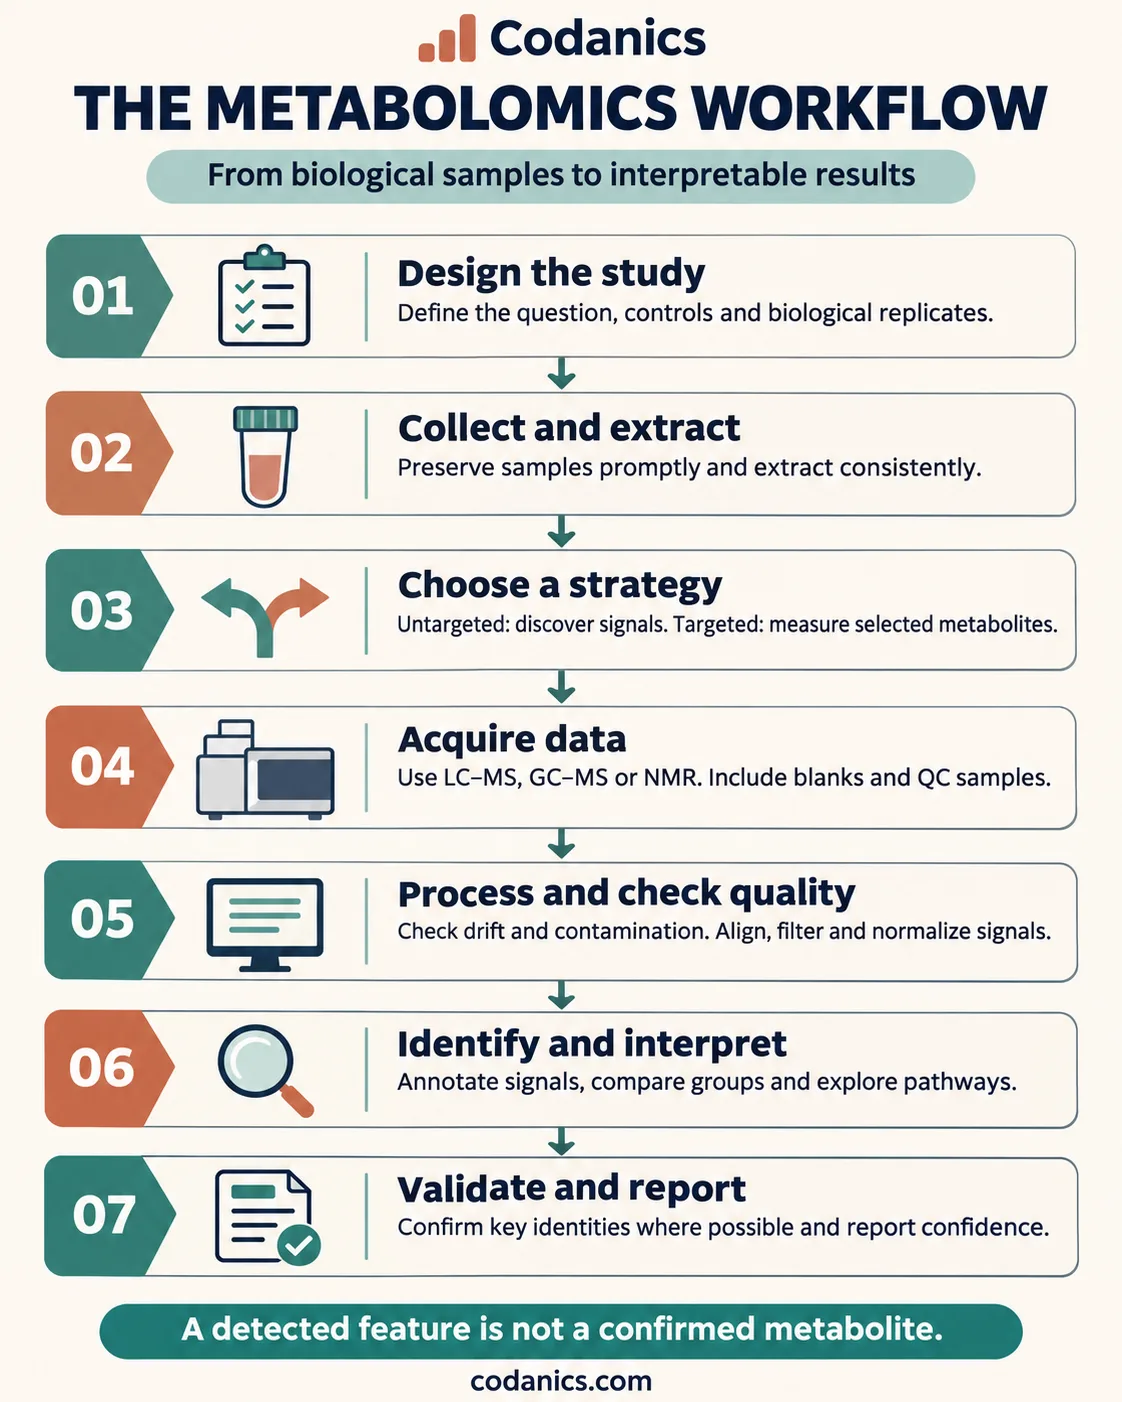
- The eight-step metabolomics workflow
- Study design, sample preparation and quality control
- How LC-MS, GC-MS and NMR detect metabolites
- Data processing: from raw signals to a feature table
- Statistics: PCA, PLS-DA, volcano plots (with Python)
- Metabolite identification and confidence levels
- Pathway analysis: turning molecules into biology
- Real-world applications
- Challenges, frontiers and multi-omics
- Your learning roadmap
- The free video course
- Key papers
- Tools and databases
- Glossary
- FAQ
What is metabolomics? Metabolites and the metabolome
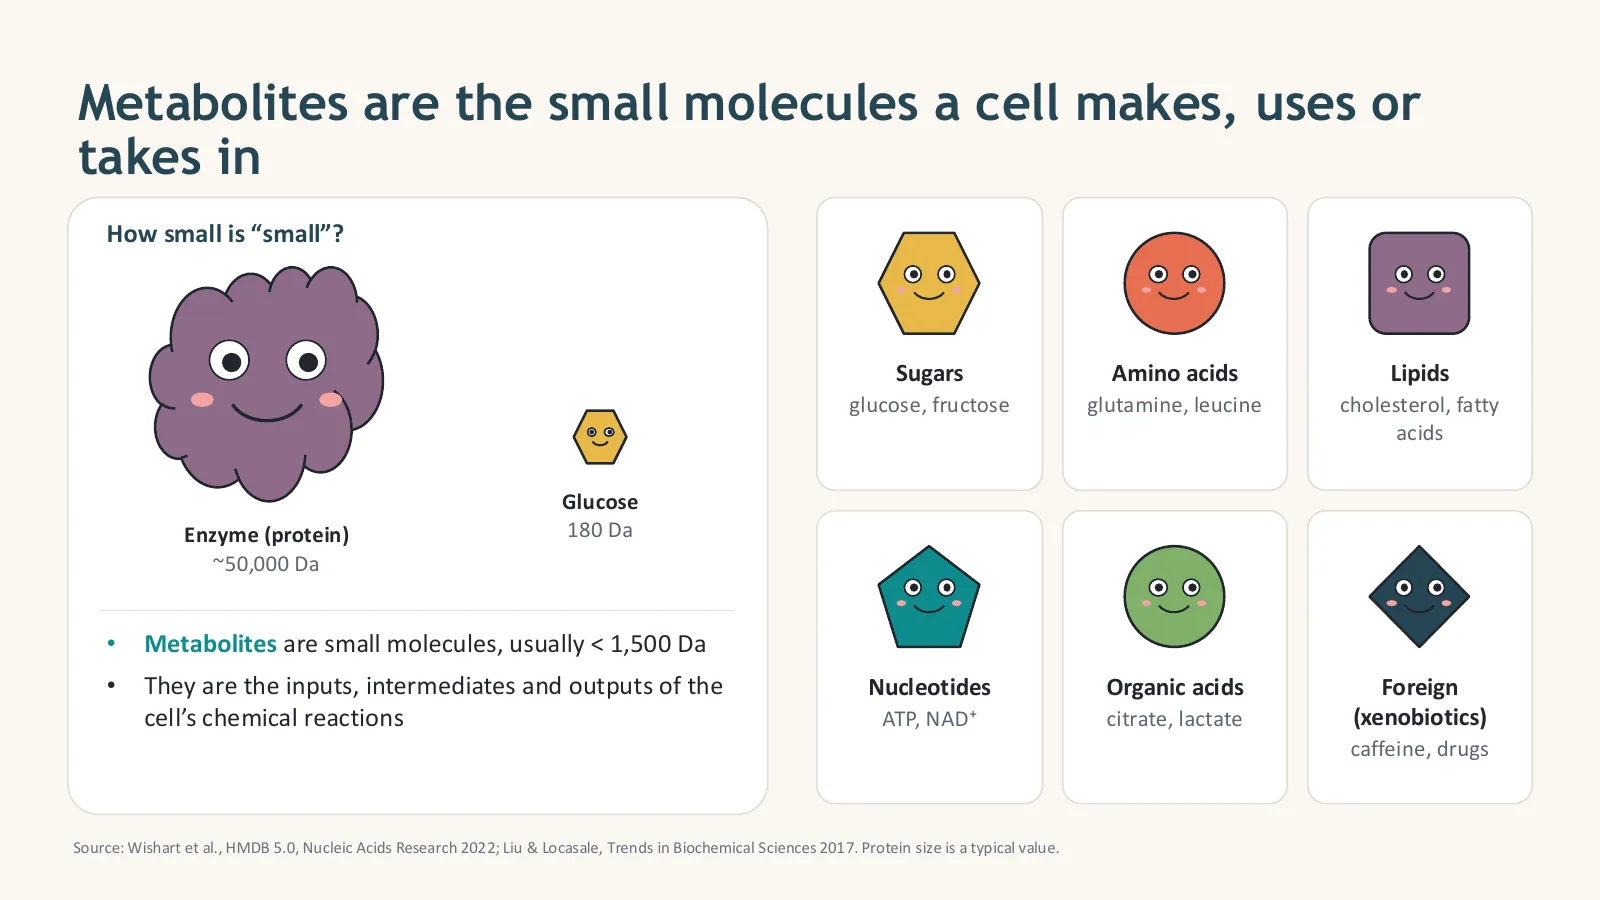
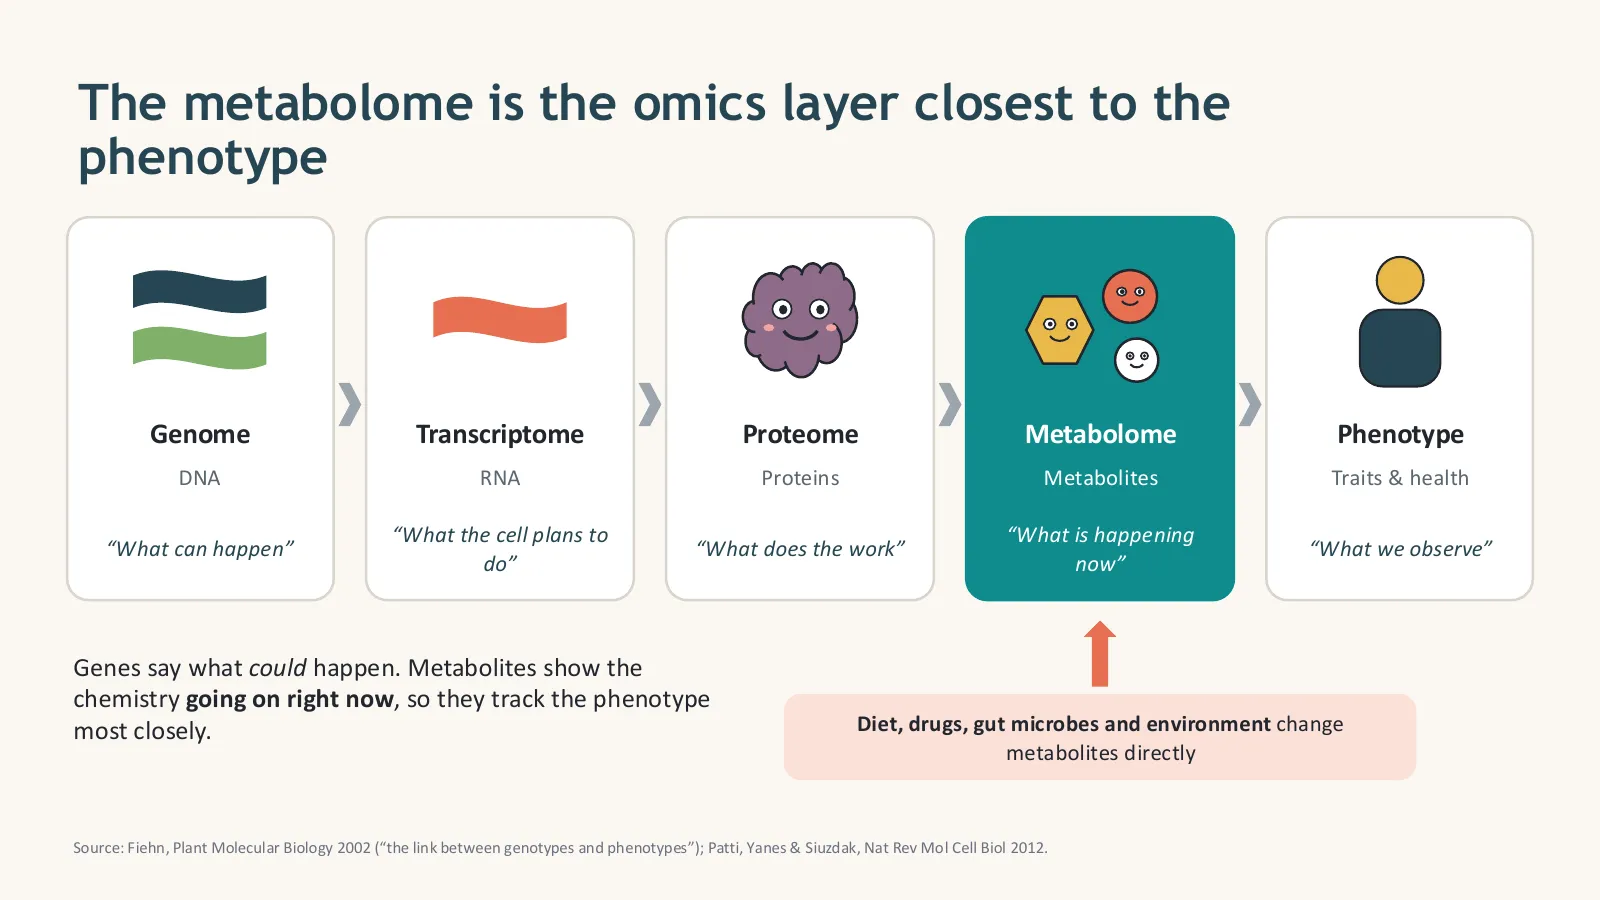
Metabolites are the small molecules a cell makes, uses or takes in, usually smaller than about 1,500 daltons: sugars, amino acids, lipids, nucleotides, organic acids, vitamins, and foreign chemicals such as drugs. The metabolome is the complete set of metabolites in a sample at one moment, and metabolomics is the large-scale study of it. Because metabolites react to genes, diet, drugs, microbes and environment, the metabolome is the omics layer closest to the phenotype.
How small is “small”? A typical enzyme weighs around 50,000 daltons (Da); glucose weighs 180 Da. Metabolites are the inputs, intermediates and outputs of the cell’s chemical reactions: glucose is broken down to pyruvate, pyruvate becomes lactate or enters the TCA cycle, and so on.
| Class | Examples | Why they matter |
|---|---|---|
| Sugars | glucose, fructose | Energy and building blocks |
| Amino acids | glutamine, leucine, phenylalanine | Protein building blocks, signalling, disease markers |
| Lipids | cholesterol, fatty acids, phospholipids | Membranes, energy storage, hormones (studied in lipidomics) |
| Nucleotides | ATP, NAD⁺ | Energy currency and redox cofactors |
| Organic acids | citrate, lactate, succinate | Central metabolism (glycolysis, TCA cycle) |
| Xenobiotics | caffeine, drugs, pesticides | Exposure, drug metabolism, toxicology |
Why the metabolome is closest to the phenotype
Think of the “omics cascade”. The genome says what can happen, the transcriptome what the cell plans to do, and the proteome what does the work. The metabolome shows what is happening now, so it tracks traits and health most closely. Oliver Fiehn called metabolomics “the link between genotypes and phenotypes” (Plant Molecular Biology, 2002).
Your metabolome mixes chemistry from five sources
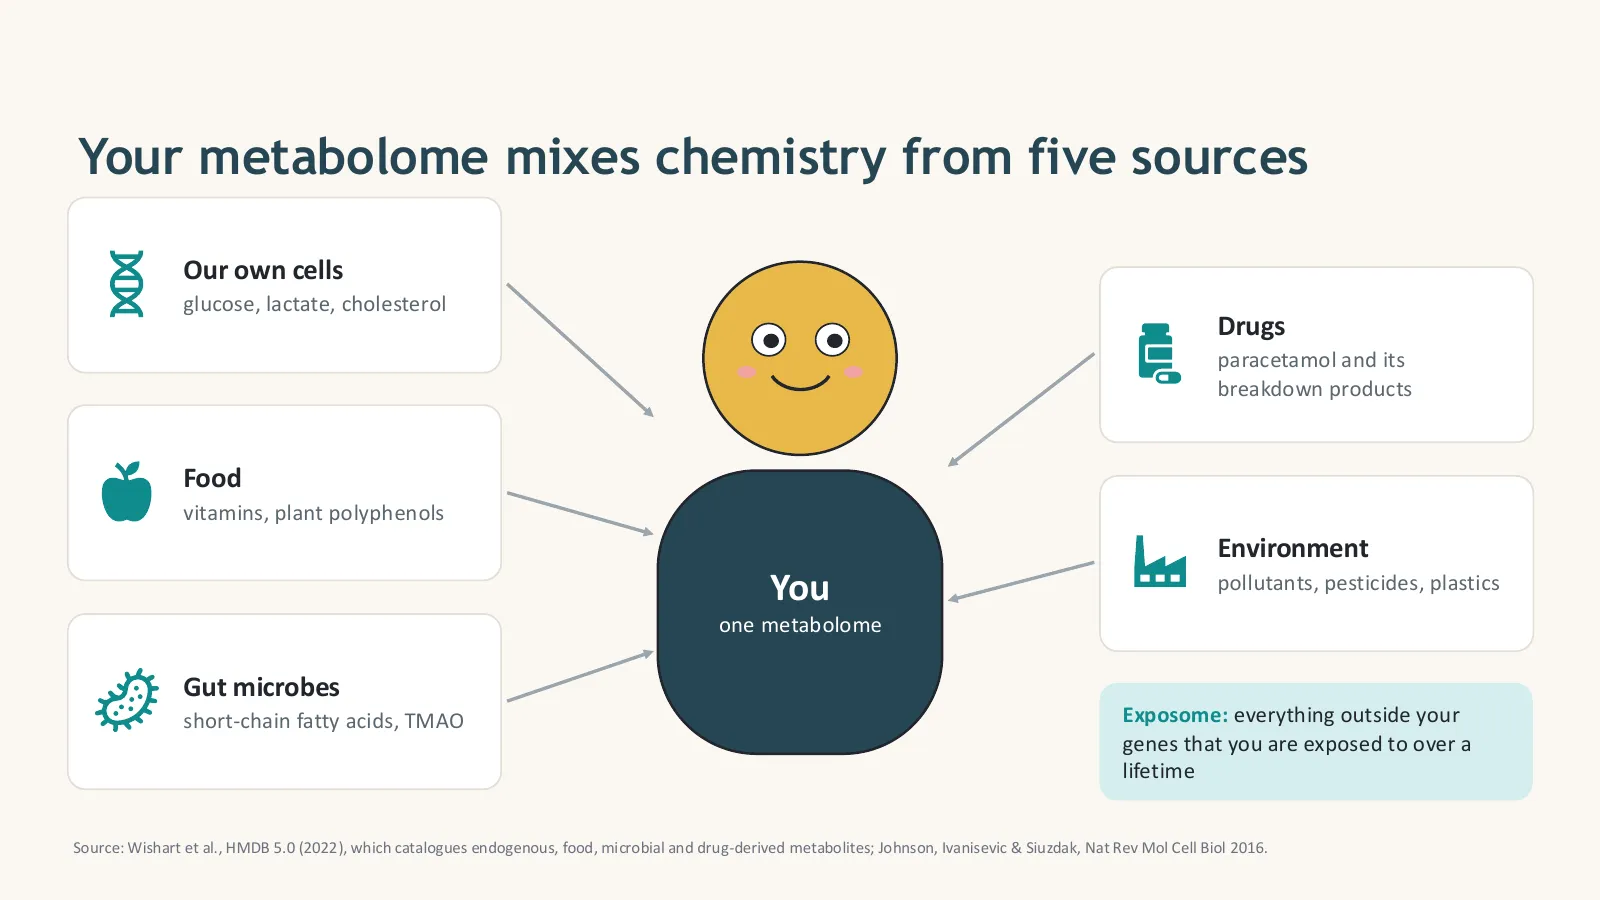
Not every molecule in your blood was made by your own cells. The human metabolome combines chemistry from your cells (glucose, lactate, cholesterol), food (vitamins, plant polyphenols), gut microbes (short-chain fatty acids, TMAO), drugs (paracetamol and its breakdown products) and the environment (pollutants, pesticides, plastics). Everything outside your genes that you are exposed to over a lifetime is called the exposome.
Start the video course here. In episode 1 I explain these basics in Urdu/Hindi, with examples from biology and disease research:

- Metabolites are small molecules, usually below 1,500 Da.
- The metabolome is the full set of metabolites at one moment.
- It is the omics layer closest to the phenotype and reacts to diet, drugs, microbes and environment.
How did metabolomics grow into a major omics field?
Metabolomics went mainstream in about 25 years. The term metabonomics was coined in 1999 for NMR studies of body fluids, metabolomics was framed as the link from genotype to phenotype in 2002, the Human Metabolome Database launched with 2,180 metabolites in 2007 alongside the first reporting standards, and by 2022 HMDB 5.0 listed about 218,000 entries. Today the frontier is single-cell, spatial and population-scale metabolomics.
- 1999“Metabonomics” is coined for NMR studies of metabolic responses in body fluids (Nicholson, Lindon & Holmes, Xenobiotica).
- 2002The link from genotype to phenotype: Fiehn frames metabolomics as the missing layer (Plant Mol Biol).
- 2007HMDB launches with 2,180 metabolites, and the Metabolomics Standards Initiative proposes the first reporting standards (Sumner et al.).
- 2012“The apogee of the omics trilogy” (Patti, Yanes & Siuzdak, Nat Rev Mol Cell Biol).
- 2016Beyond biomarkers, towards mechanisms (Johnson et al.).
- 2021Community guide to MS best practice for annotation, quantification and reporting (Alseekh et al., Nat Methods).
- 2022HMDB 5.0 lists about 218,000 entries (Wishart et al., NAR).
- TodaySingle-cell, spatial and population-scale studies, and AI tools that predict structures from MS/MS spectra.
The human metabolome catalogue grew 100× in 15 years
- From NMR metabonomics in 1999 to a mainstream omics field today.
- HMDB grew from 2,180 to about 218,000 entries between 2007 and 2022.
- Most detected signals are still unidentified.
What is the difference between targeted and untargeted metabolomics?
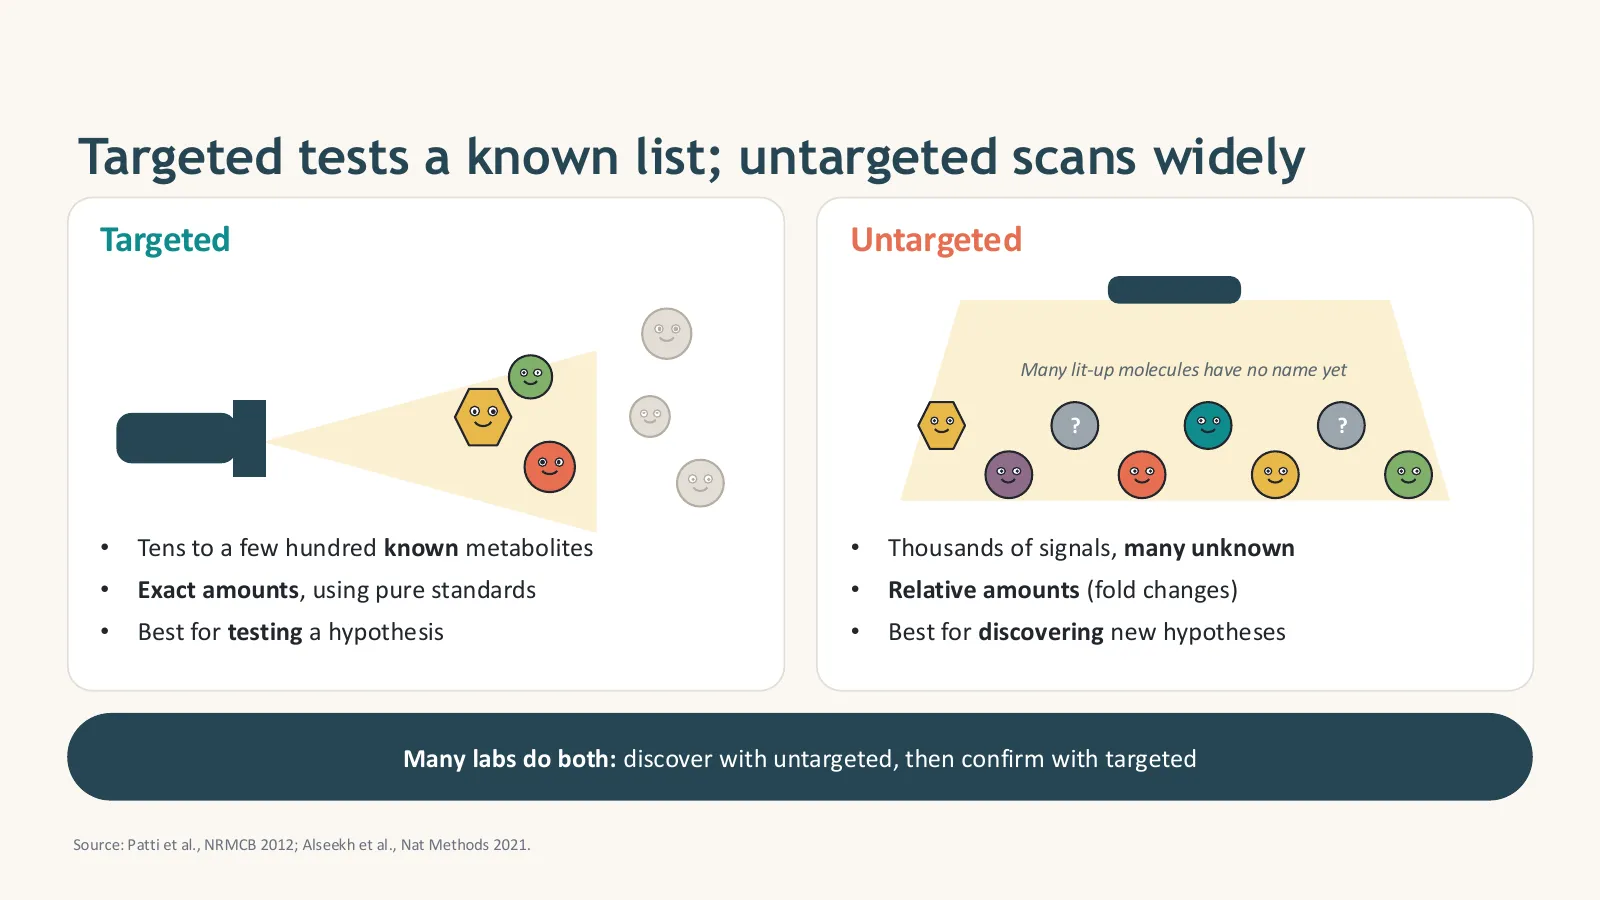
Targeted metabolomics measures a predefined list of known metabolites, usually tens to a few hundred, with exact concentrations using pure standards; it is best for testing a hypothesis. Untargeted metabolomics scans widely, detecting thousands of signals as relative amounts, many of them unknown; it is best for discovering new hypotheses. Many labs do both: discover with untargeted, then confirm with targeted.
| Targeted | Untargeted | |
|---|---|---|
| Goal | Test a hypothesis | Discover new hypotheses |
| Metabolites | Tens to a few hundred, all known | Thousands of signals, many unknown |
| Amounts | Absolute (exact concentrations with standards) | Relative (fold changes between groups) |
| Typical MS | Triple quadrupole, MRM mode | High-resolution (Orbitrap, Q-TOF) |
| Data analysis | Simpler: a clean concentration table | Complex: peak picking, alignment, annotation |
| Main risk | Missing what you did not look for | False discoveries and unidentified features |
- Targeted: known list, exact amounts, hypothesis testing.
- Untargeted: wide scan, relative amounts, discovery.
- The strongest studies discover untargeted and confirm targeted.
What are the steps of a metabolomics study?
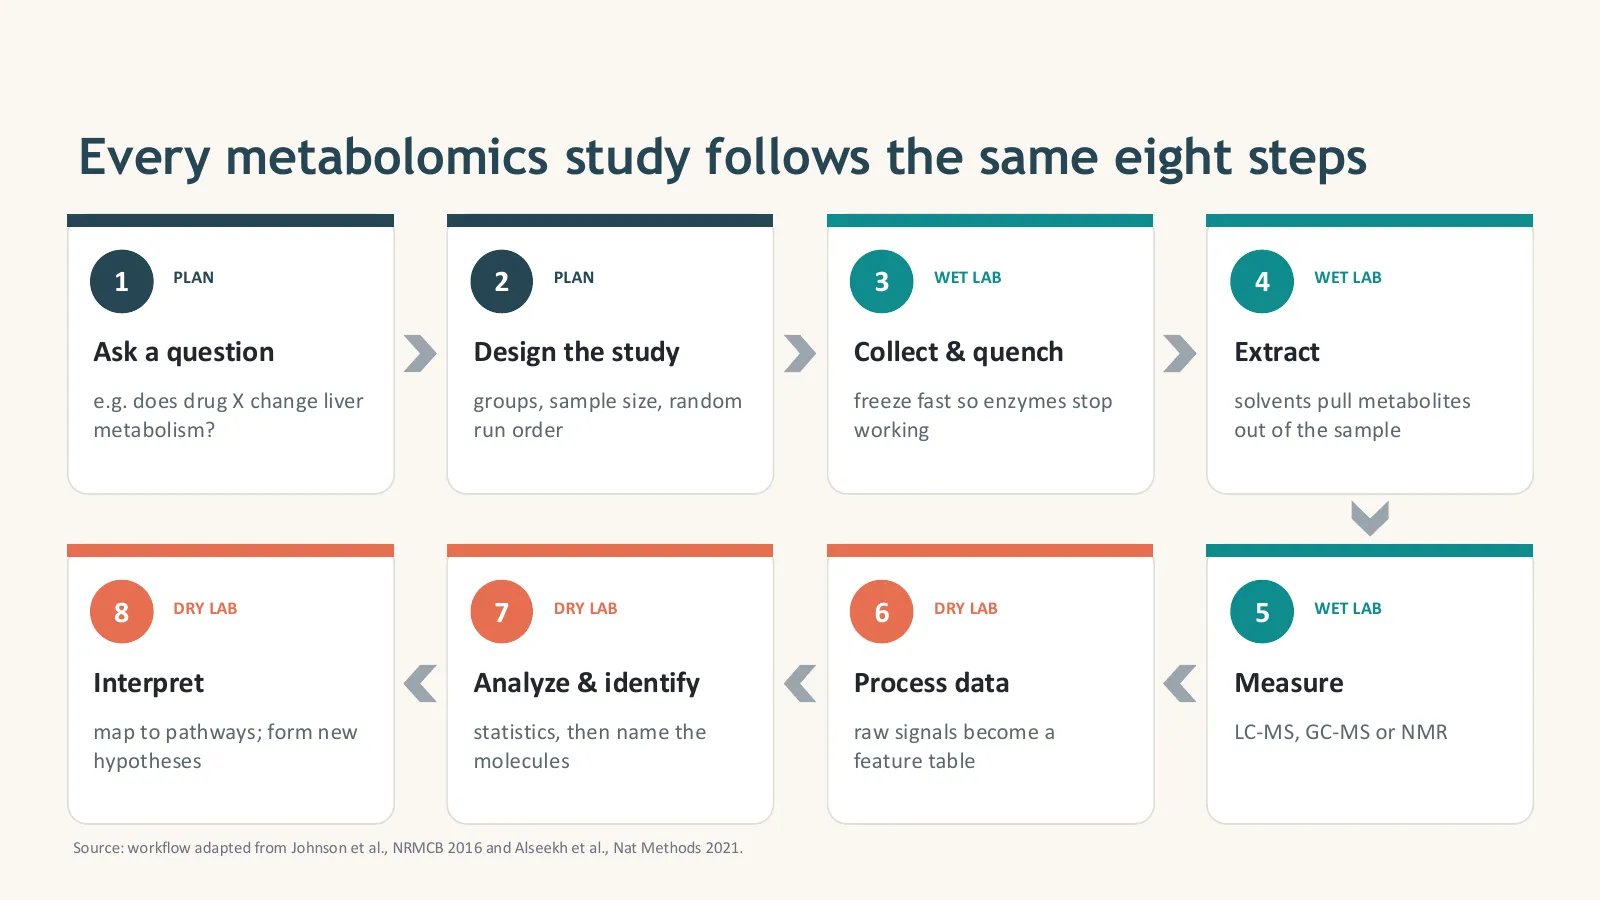
Every metabolomics study follows the same eight steps in three phases. Plan: ask a clear question and design the study. Wet lab: collect and quench samples, extract the metabolites and measure them with LC-MS, GC-MS or NMR. Dry lab: process raw signals into a feature table, run statistics and identify the molecules, then interpret the results on pathways and validate key findings.
- PlanAsk a questione.g. does drug X change liver metabolism?
- PlanDesign the studygroups, controls, biological replicates, random run order
- Wet labCollect and quenchfreeze fast so enzymes stop working
- Wet labExtractsolvents pull metabolites out of the sample
- Wet labMeasureLC-MS, GC-MS or NMR, with blanks and QCs
- Dry labProcess dataraw signals become a feature table
- Dry labAnalyze and identifystatistics, then name the molecules
- Dry labInterpretmap to pathways; validate; form new hypotheses
In episode 3 of the course I walk through this whole workflow in detail, including the dry-lab pipeline step by step. If you plan to process your own raw data, this is your roadmap:
- Plan → wet lab → dry lab: eight steps in total.
- Mistakes in planning cannot be fixed by software later.
- The dry lab (steps 6–8) is where bioinformaticians create the most value.
How do you design a metabolomics study and control data quality?
Data quality is decided before the instrument runs. Use biological replicates in every group, randomize the run order so instrument drift cannot pose as biology, quench metabolism fast with liquid nitrogen or cold solvent, extract every sample the same way, and include pooled QC samples, internal standards and blanks. Record metadata such as fasting state, time of sampling and storage, because metabolites change quickly.
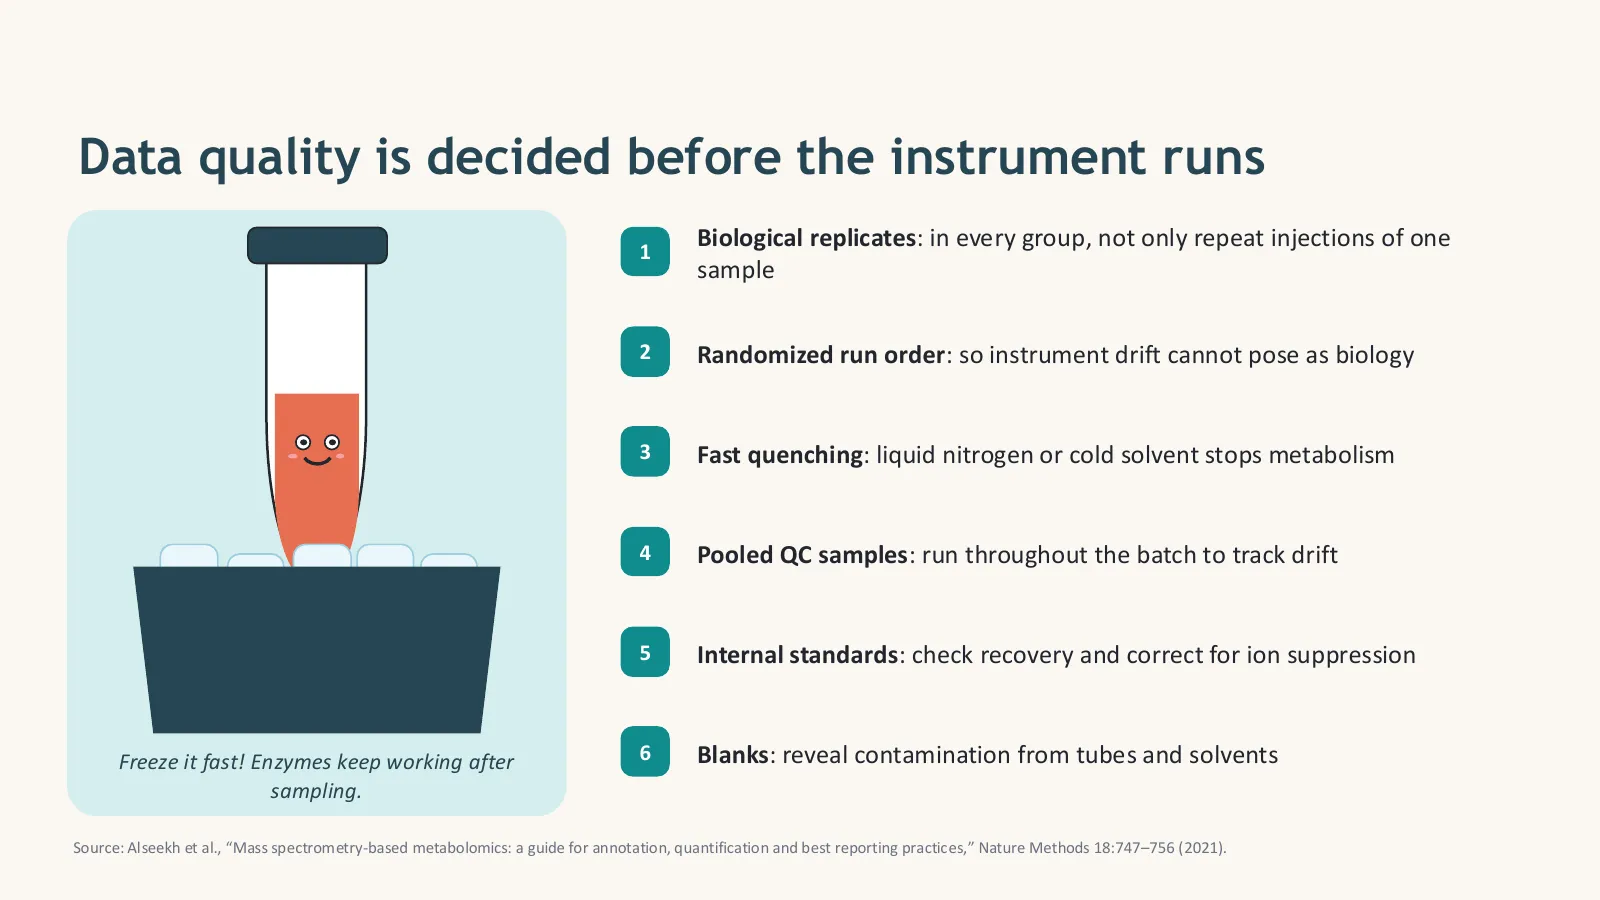
Your study-design checklist
- One clear question and a defined comparison (for example treated vs control, disease vs healthy, time course).
- Biological replicates in every group, not only repeat injections of one sample. Use pilot data or a power analysis to choose the number.
- Control confounders: match age, sex, diet, fasting state and time of sampling, or record them for statistics.
- Randomize the run order, and the extraction order, so drift and batch effects are not confused with groups.
- Plan QC samples: a pooled QC every 5–10 injections, internal standards in every sample, extraction and solvent blanks.
- Write down everything: sample collection, storage, freeze–thaw cycles and instrument settings. You will need it for reporting.
Sample types and how to handle them
| Sample | Tips |
|---|---|
| Blood plasma or serum | Choose one and use it for all samples; standardize fasting and clotting time; process quickly and store at −80 °C |
| Urine | Strong dilution differences between samples: normalize to creatinine, osmolality or with PQN |
| Tissue | Snap-freeze in liquid nitrogen within seconds; record the wet or dry weight for normalization |
| Cells | Wash quickly, quench with cold solvent, normalize to cell number or protein content |
| Plants and microbes | Metabolism is fast: quench immediately; freeze-dry plant tissue for stable storage |
Quenching and extraction
Enzymes keep working after sampling, so some metabolites (for example ATP or glucose-6-phosphate) change within seconds. Quenching stops metabolism with liquid nitrogen or cold solvent. Extraction then pulls the metabolites out: cold methanol, acetonitrile or methanol–water mixtures for polar metabolites, and two-phase methods (for example with chloroform or MTBE) to separate polar metabolites from lipids. Whatever you choose, extract every sample the same way, in random order.
- Biological replicates and randomization are not optional.
- Quench fast; extract consistently.
- Pooled QCs, internal standards and blanks make your data trustworthy.
How do mass spectrometry and NMR detect metabolites?
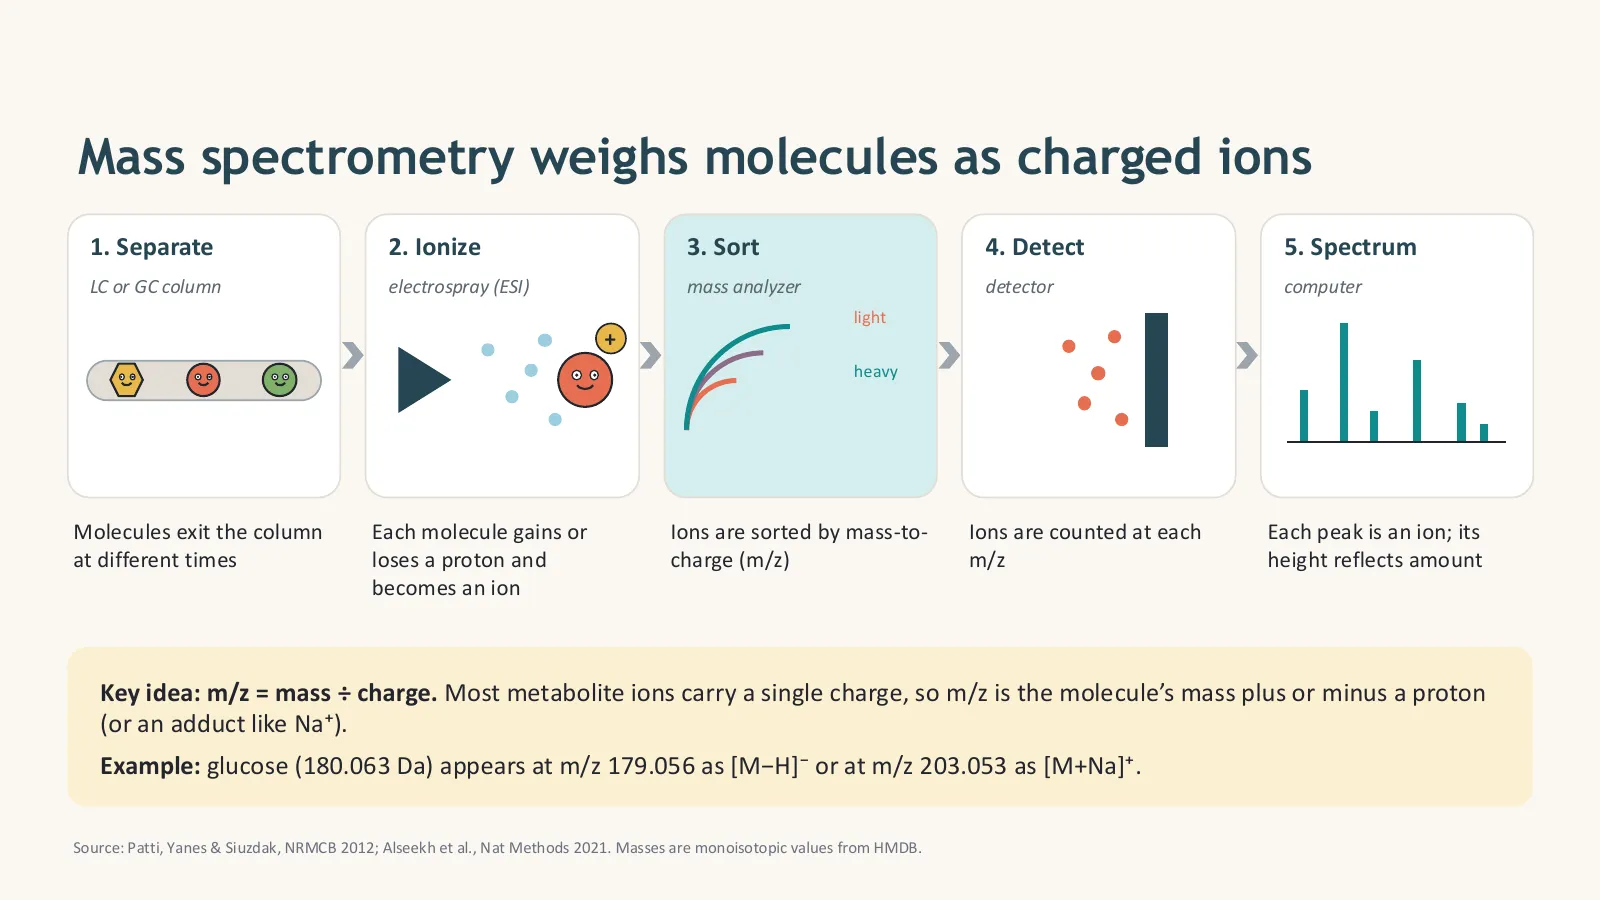
Mass spectrometry weighs molecules as charged ions: a chromatography column (LC or GC) first separates the mixture, an ion source such as electrospray gives each molecule a charge, a mass analyzer sorts the ions by mass-to-charge ratio (m/z), and a detector counts them. MS/MS fragments an ion to fingerprint its structure. NMR instead measures how atomic nuclei, usually ¹H, absorb radio waves in a strong magnet; it detects fewer metabolites but is highly reproducible, quantitative and non-destructive.
| Platform | Best for | Notes |
|---|---|---|
| LC-MS | Most metabolites: polar and non-polar, lipids | Reversed-phase (RP) columns for less polar compounds, HILIC for very polar ones; run positive and negative ionization modes |
| GC-MS | Small, volatile or derivatized compounds: organic acids, sugars, amino acids | Very reproducible spectra and large libraries (e.g. NIST); needs chemical derivatization for many metabolites |
| NMR | Abundant metabolites; absolute quantification; structure | Non-destructive and very reproducible, but less sensitive (µM range) |
| CE-MS | Charged, highly polar metabolites | Capillary electrophoresis needs very small sample volumes |
m/z and adducts: why one molecule gives several signals
m/z means mass divided by charge. Most metabolite ions carry a single charge, so m/z is the molecule’s mass plus or minus a proton, or plus another ion (an adduct) such as Na⁺, K⁺ or NH₄⁺. Glucose (monoisotopic mass 180.0634 Da) appears at m/z 179.0561 as [M−H]⁻ in negative mode and at 203.0526 as [M+Na]⁺ in positive mode. This short script calculates the common ions and matches an observed m/z within a ppm tolerance:
# mz_calculator.py: which m/z values will a metabolite give in the mass spectrometer?
# No extra packages needed (standard Python 3).

PROTON = 1.007276   # mass of a proton (Da)
NA = 22.989218      # Na+ ion
K = 38.963158       # K+ ion
NH4 = 18.033823     # NH4+ ion

# Monoisotopic masses (Da) from HMDB
METABOLITES = {
    "glucose": 180.063388,
    "phenylalanine": 165.078979,
    "lactate (lactic acid)": 90.031694,
    "citrate (citric acid)": 192.027003,
    "glutamine": 146.069142,
}


def adducts(m):
    """Common single-charge ions for a neutral mass m."""
    return {
        "[M+H]+": m + PROTON,
        "[M+Na]+": m + NA,
        "[M+K]+": m + K,
        "[M+NH4]+": m + NH4,
        "[M-H]-": m - PROTON,
    }


def ppm_error(observed, theoretical):
    """Mass error in parts per million (ppm)."""
    return (observed - theoretical) / theoretical * 1e6


def match(observed_mz, tolerance_ppm=5):
    """Find which metabolite/adduct could explain an observed m/z."""
    hits = []
    for name, mass in METABOLITES.items():
        for ion, mz in adducts(mass).items():
            err = ppm_error(observed_mz, mz)
            if abs(err) <= tolerance_ppm:
                hits.append((name, ion, round(mz, 4), round(err, 2)))
    return hits


if __name__ == "__main__":
    for name, mass in METABOLITES.items():
        ions = ", ".join(f"{ion} {mz:.4f}" for ion, mz in adducts(mass).items())
        print(f"{name:22s} M = {mass:.4f} -> {ions}")
    print()
    for observed in [179.0560, 166.0864, 203.0530]:
print(f"Observed m/z {observed}: {match(observed) or 'no match within 5 ppm'}")python mz_calculator.py
MS/MS: fragment patterns fingerprint a molecule
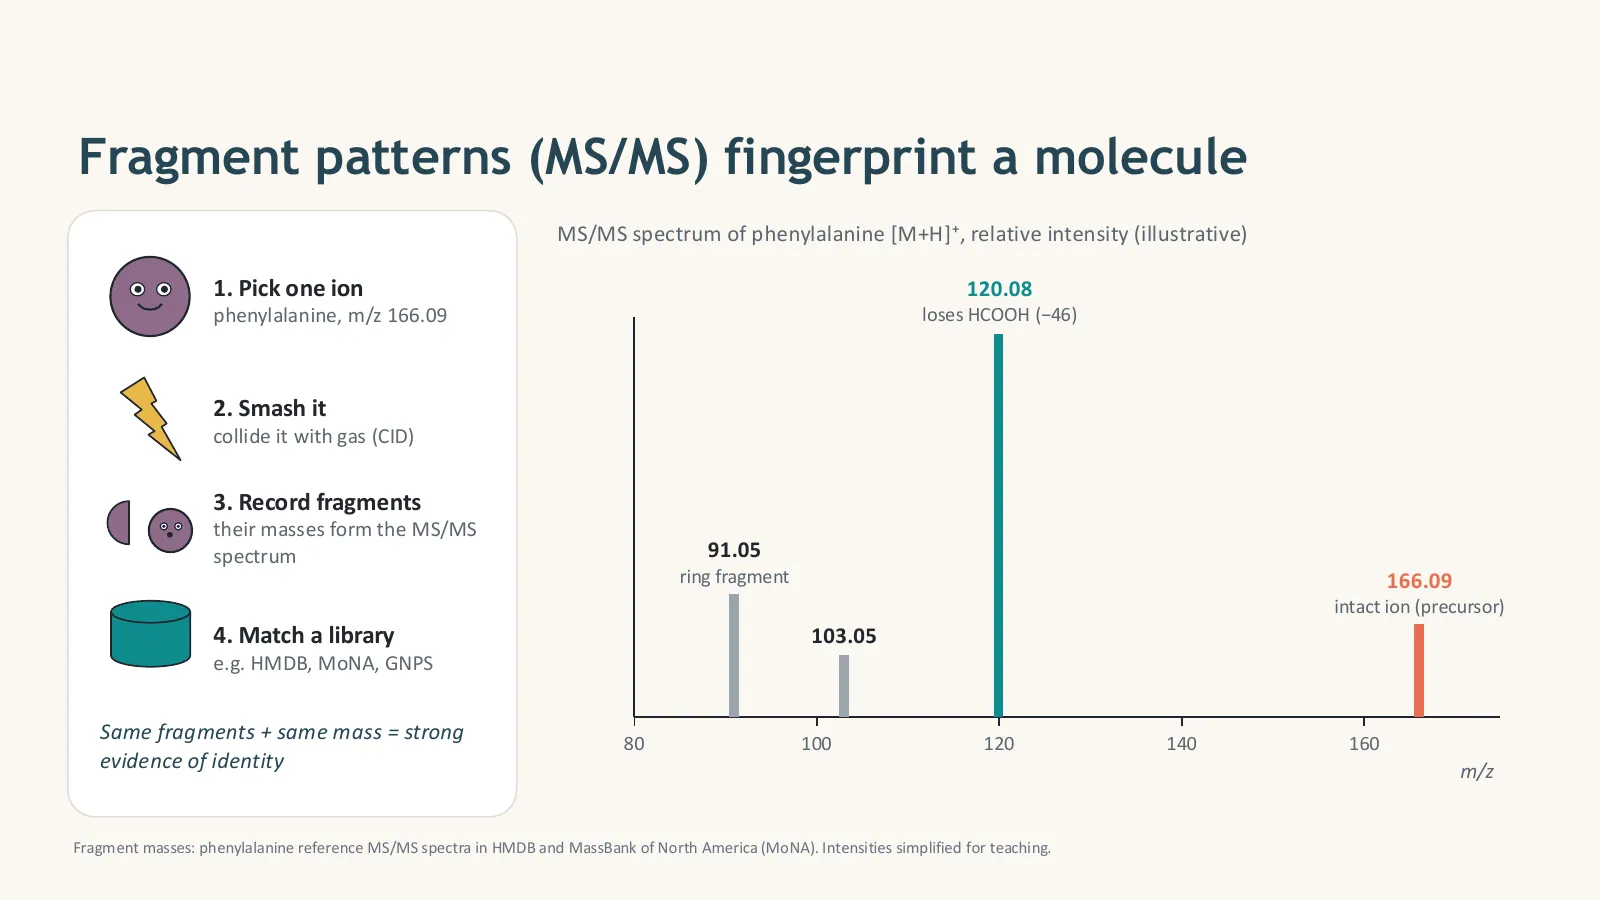
In tandem mass spectrometry, the instrument picks one ion (the precursor), smashes it by collision with gas (CID) and records the fragments. Phenylalanine [M+H]⁺ at m/z 166.09 loses formic acid (−46) to give 120.08, and also produces a ring fragment at 91.05. The same fragments plus the same mass are strong evidence of identity. In untargeted work, instruments collect MS/MS automatically, either for the most intense ions (DDA, data-dependent acquisition) or for all ions in wide windows (DIA, data-independent acquisition).
MS or NMR?
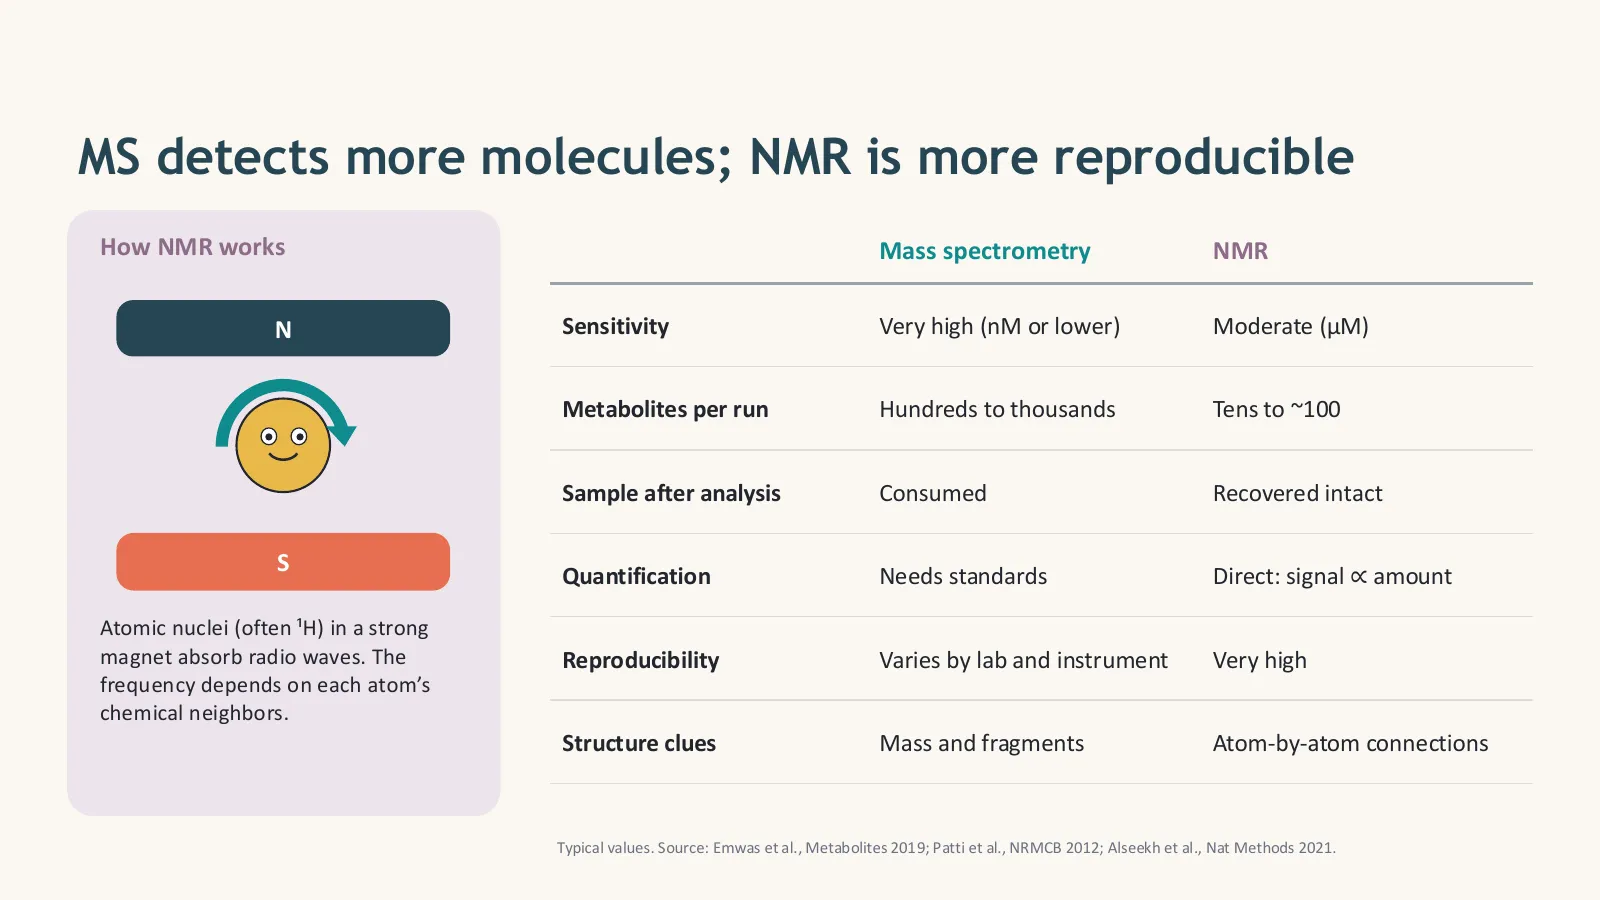
- LC-MS detects the most metabolites; GC-MS and NMR have their own strengths.
- One metabolite gives several ions (adducts, isotopes): mass alone is not identity.
- MS/MS fragments are the fingerprint that supports identification.
How is raw metabolomics data processed into a feature table?
Processing software turns raw instrument files into a feature table in four main steps: peak picking finds every signal, alignment matches the same peak across samples despite small retention-time shifts, cleaning fills gaps and removes noise, blank signals and unstable features, and normalization corrects for drift and dilution. Free tools such as MZmine, MS-DIAL and XCMS do this. The result is a table of samples by features, where a feature is one m/z at one retention time.
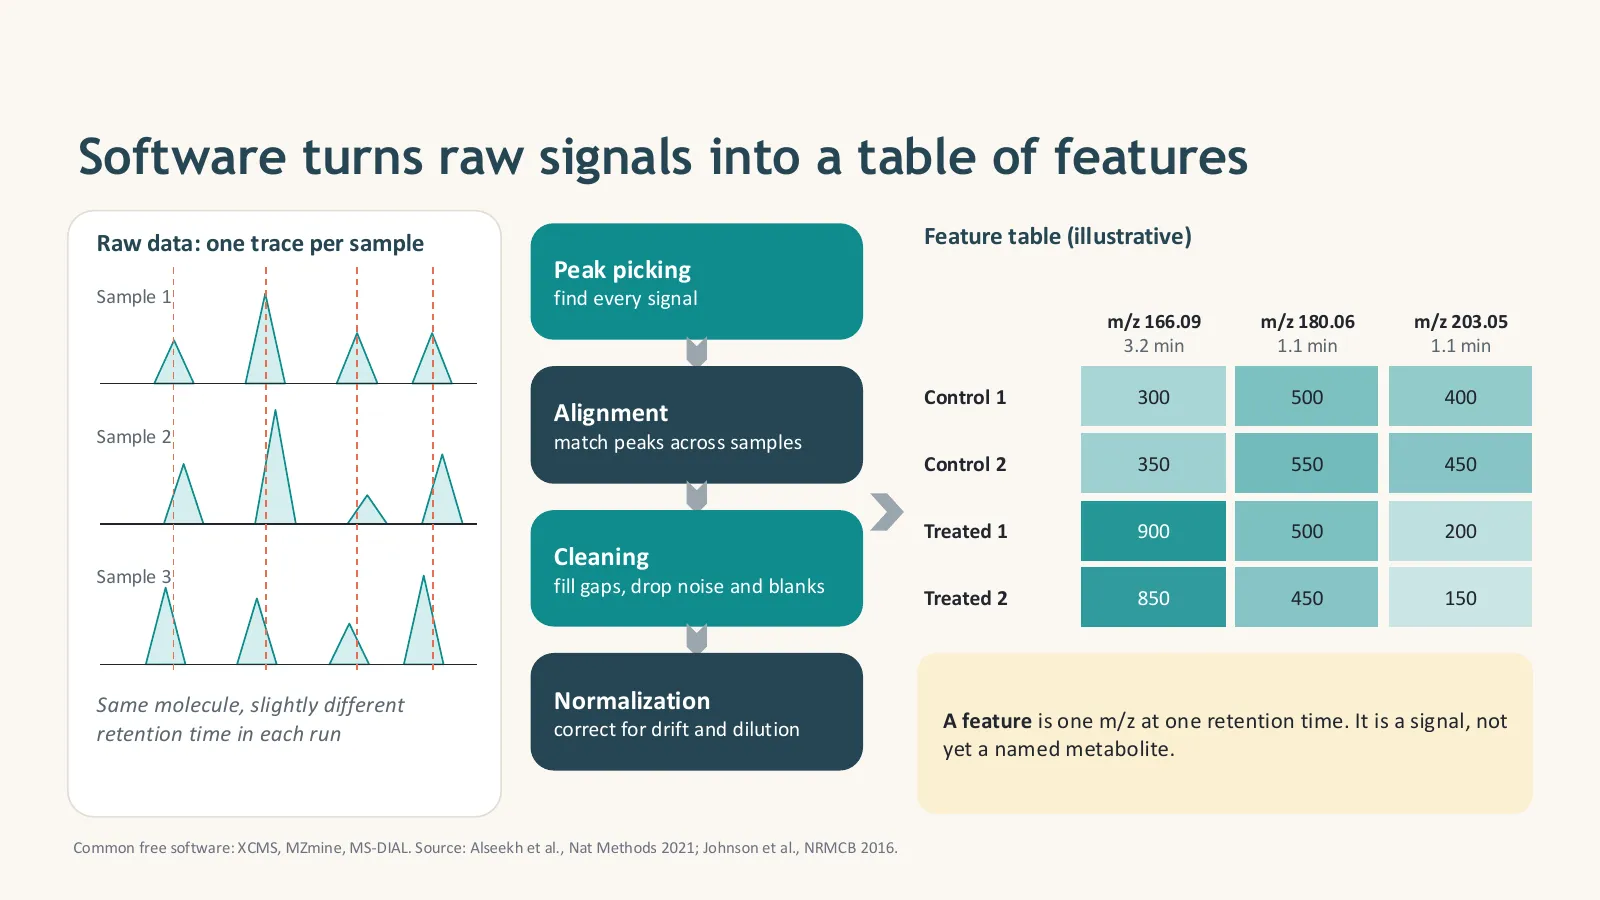
The processing pipeline, step by step
- Convert files from the vendor format to open mzML with ProteoWizard msConvert (MS-DIAL also reads many vendor files directly).
- Peak picking: detect chromatographic peaks for every m/z in every sample.
- Alignment: match the same feature across samples and correct retention-time shifts.
- Gap filling: go back to the raw data to recover peaks missed in some samples.
- Grouping: link isotopes, adducts and in-source fragments that belong to one compound (e.g. CAMERA, MS-DIAL, MZmine ion identity networking).
- Filtering: remove features found in blanks (e.g. sample/blank ratio below 3), missing in most samples, or unstable in pooled QCs (RSD above 20–30%).
- Drift and batch correction: model the QC signal over the run order (e.g. LOESS-based QC-RSC) and correct every feature.
- Normalization, transformation and scaling: correct dilution (PQN, internal standards, creatinine for urine), log-transform, then scale (Pareto or autoscaling) for multivariate statistics.
| Tool | What it does | Cost |
|---|---|---|
| MZmine | LC-MS and GC-MS processing with a graphical interface; ion identity networking; export to GNPS and SIRIUS | Free, open source |
| MS-DIAL | DDA and DIA processing, built-in spectral libraries, lipidomics | Free |
| XCMS | R/Bioconductor package for peak picking, alignment and grouping | Free, open source |
| MetaboAnalyst | Web platform for statistics, enrichment and pathway analysis, and raw-spectra processing | Free |
| Vendor software | e.g. Compound Discoverer, Progenesis QI, MassHunter | Commercial |
| NMR tools | e.g. NMRProcFlow (free) for spectra processing, Chenomx for quantification | Free / commercial |
In episode 4, a one-minute summary, I list the core tasks a bioinformatician owns in a metabolomics project:

- Peak picking → alignment → cleaning → normalization.
- Use pooled QCs and blanks to filter unreliable features.
- A feature is a signal, not yet a named metabolite.
Which statistics are used in metabolomics, and how do you run them in Python?
Start unsupervised with PCA to see groups, trends and outliers, and check that pooled QCs cluster tightly. Then test each feature with a t-test, Welch test or Mann–Whitney test on log-transformed data and correct for multiple testing with the Benjamini–Hochberg false discovery rate. Show results in a volcano plot of fold change against significance. Supervised models such as PLS-DA can rank features by VIP score, but they overfit easily and must be validated with cross-validation and permutation tests.
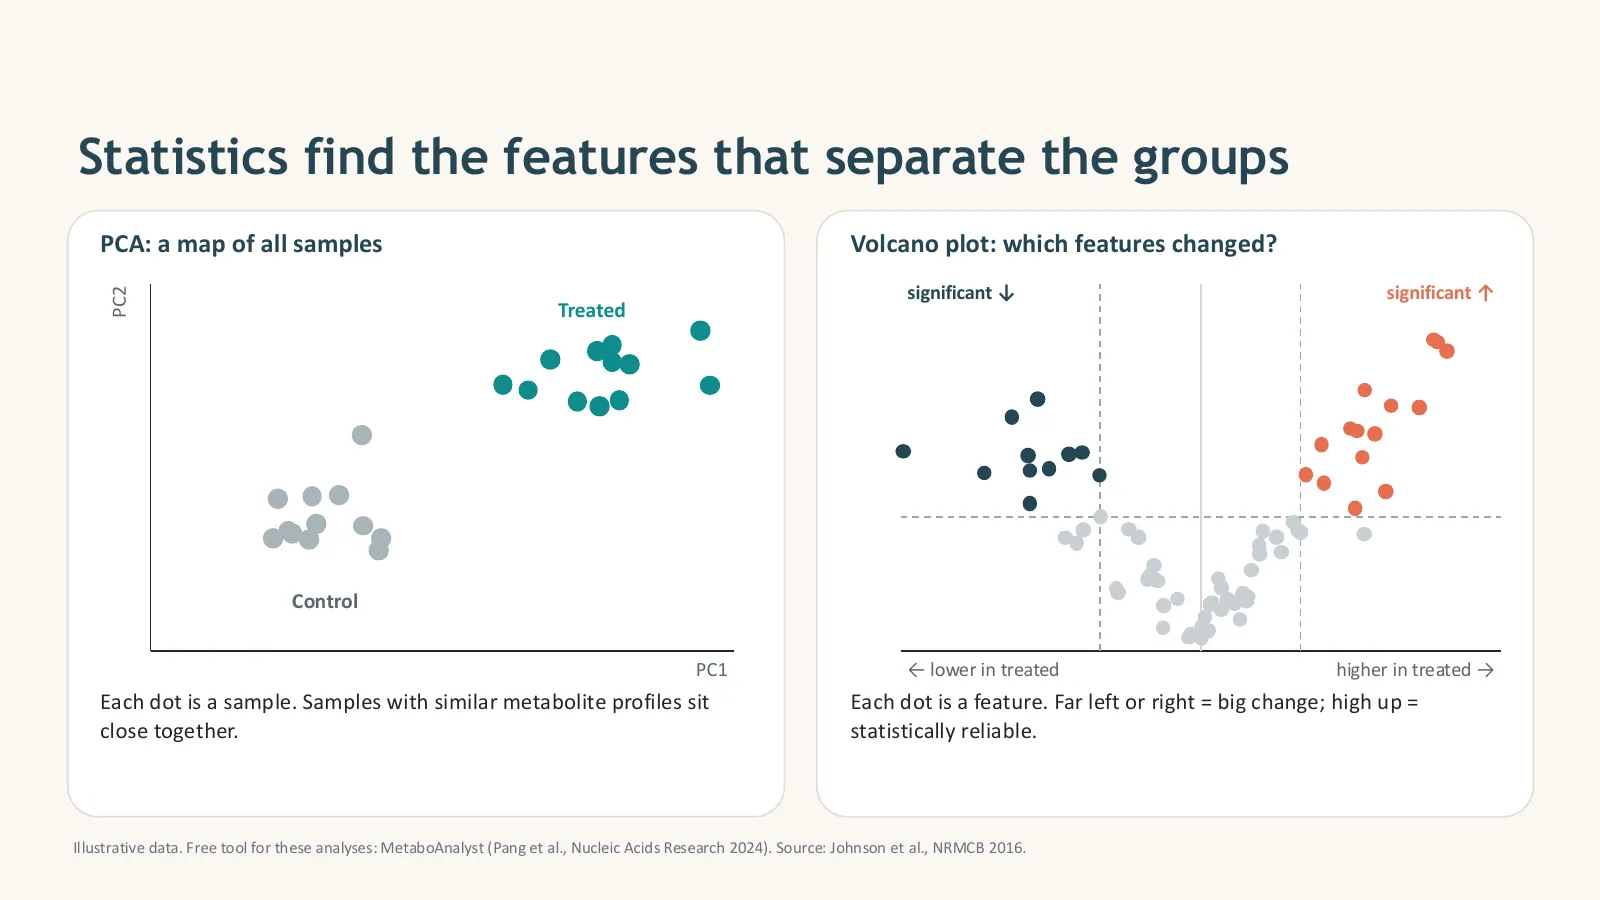
| Method | Question it answers | Watch out for |
|---|---|---|
| PCA | Do samples group? Are there outliers or batch effects? Do QCs cluster? | Unsupervised: groups may not separate even when real differences exist |
| PLS-DA / OPLS-DA | Which features best separate known groups (VIP scores)? | Overfits easily: report cross-validated Q² and a permutation test |
| t-test / Welch / Mann–Whitney | Is this feature different between two groups? | Thousands of tests: always correct with FDR |
| ANOVA / Kruskal–Wallis | Differences among three or more groups | Follow with post-hoc tests |
| Fold change | How big is the change? | Combine with significance: big but noisy is not reliable |
| Random forest, ROC curves | Can a biomarker panel classify new samples? | Validate on an independent cohort |
A complete pipeline in Python
These two scripts let you practise without your own data. The first makes a realistic example feature table (22 samples: 8 control, 8 treated, 6 pooled QCs; 300 features, of which 30 really change). The second runs the full pipeline: missing-value filter, imputation, QC-RSD filter, PQN normalization, log transformation, Pareto scaling, PCA, Welch t-tests with FDR, and a volcano plot. To use your own data, export a CSV with the same layout from MZmine, MS-DIAL or XCMS.
# make_example_data.py: create a realistic example feature table to practise on
# pip install numpy pandas
import numpy as np
import pandas as pd

rng = np.random.default_rng(42)
n_features, n_per_group, n_qc = 300, 8, 6

# each feature gets a typical intensity (log-normal, like real LC-MS data)
base = rng.lognormal(mean=10, sigma=1.2, size=n_features)
effect = np.ones(n_features)
effect[:15] = rng.uniform(2.0, 4.0, 15)     # 15 features go UP in treated samples
effect[15:30] = rng.uniform(0.25, 0.5, 15)  # 15 features go DOWN

def samples(n, fold, noise=0.25):
    return base * fold * rng.lognormal(0, noise, size=(n, n_features))

control = samples(n_per_group, 1.0)
treated = samples(n_per_group, effect)
qc = samples(n_qc, (1 + effect) / 2, noise=0.08)           # pooled QC = mix of all samples
dilution = rng.uniform(0.7, 1.3, size=(2 * n_per_group + n_qc, 1))  # unequal sample amounts
X = np.vstack([control, treated, qc]) * dilution
X[rng.random(X.shape) < 0.03] = np.nan                      # a few missing values, as in real data

names = [f"C{i+1}" for i in range(n_per_group)] + [f"T{i+1}" for i in range(n_per_group)] + [f"QC{i+1}" for i in range(n_qc)]
groups = ["Control"] * n_per_group + ["Treated"] * n_per_group + ["QC"] * n_qc
mz = np.round(rng.uniform(70, 900, n_features), 4)
rt = np.round(rng.uniform(0.5, 15, n_features), 2)
cols = [f"{m}_{r}" for m, r in zip(mz, rt)]                 # feature name = m/z_retention time

df = pd.DataFrame(X, columns=cols)
df.insert(0, "group", groups)
df.insert(0, "sample", names)
df.to_csv("feature_table.csv", index=False)
print(f"Saved feature_table.csv: {df.shape[0]} samples x {n_features} features")# metabolomics_stats.py: from a feature table to PCA, statistics and a volcano plot
# pip install numpy pandas scipy scikit-learn matplotlib
# Input: feature_table.csv with columns sample, group (Control / Treated / QC), then one column per feature
import numpy as np
import pandas as pd
import matplotlib.pyplot as plt
from scipy import stats
from sklearn.decomposition import PCA
df = pd.read_csv("feature_table.csv")
meta, X = df[["sample", "group"]], df.drop(columns=["sample", "group"])
print("Start:", X.shape[1], "features")
# 1. Remove features missing in more than half of the samples
X = X.loc[:, X.isna().mean() <= 0.5]
# 2. Fill the remaining gaps with 1/5 of the feature's smallest value (a common, simple choice)
X = X.fillna(X.min() / 5)
# 3. Keep features that are stable in the pooled QC samples (RSD below 30%)
qc = X[meta.group == "QC"]
rsd = qc.std() / qc.mean() * 100
X = X.loc[:, rsd < 30]
print("After missing-value and QC-RSD filters:", X.shape[1], "features")
# 4. PQN normalization: corrects for samples that are more or less concentrated
reference = X[meta.group == "QC"].median()
quotients = X.div(reference, axis=1)
X = X.div(quotients.median(axis=1), axis=0)
# 5. Log-transform (makes intensities more normal), then Pareto-scale for PCA
L = np.log2(X)
P = (L - L.mean()) / np.sqrt(L.std())
# 6. PCA: do the groups separate? Are the QCs tightly clustered?
pca = PCA(n_components=2)
scores = pca.fit_transform(P)
var = pca.explained_variance_ratio_ * 100
colours = {"Control": "#0072B2", "Treated": "#D55E00", "QC": "#999999"}
fig, ax = plt.subplots(figsize=(6, 5))
for g, c in colours.items():
m = (meta.group == g).values
ax.scatter(scores[m, 0], scores[m, 1], c=c, label=g, s=60, edgecolor="white")
ax.set_xlabel(f"PC1 ({var[0]:.1f}%)")
ax.set_ylabel(f"PC2 ({var[1]:.1f}%)")
ax.legend(frameon=False)
ax.set_title("PCA score plot")
fig.tight_layout()
fig.savefig("pca.png", dpi=200)
# 7. Univariate test per feature: Welch t-test on log data, then FDR correction
c, t = L[meta.group == "Control"], L[meta.group == "Treated"]
p = stats.ttest_ind(t, c, equal_var=False).pvalue
q = stats.false_discovery_control(p, method="bh") # Benjamini-Hochberg
log2fc = t.mean() - c.mean() # already in log2 units
res = pd.DataFrame({"feature": L.columns, "log2FC": log2fc.values, "p": p, "q_FDR": q})
res["significant"] = (res.q_FDR < 0.05) & (res.log2FC.abs() >= 1)
res = res.sort_values("q_FDR")
res.to_csv("results.csv", index=False)
print("Significant features (FDR < 0.05 and at least 2-fold):", int(res.significant.sum()))
print(res.head(5).to_string(index=False))
# 8. Volcano plot
fig, ax = plt.subplots(figsize=(6, 5))
col = np.where(~res.significant, "#BBBBBB", np.where(res.log2FC > 0, "#D55E00", "#0072B2"))
ax.scatter(res.log2FC, -np.log10(res.p), c=col, s=18)
ax.axvline(-1, ls="--", c="grey", lw=0.8)
ax.axvline(1, ls="--", c="grey", lw=0.8)
ax.set_xlabel("log2 fold change (Treated / Control)")
ax.set_ylabel("-log10 p-value")
ax.set_title("Volcano plot")
fig.tight_layout()
fig.savefig("volcano.png", dpi=200)
print("Saved pca.png, volcano.png and results.csv")pip install numpy pandas scipy scikit-learn matplotlib python make_example_data.py python metabolomics_stats.py
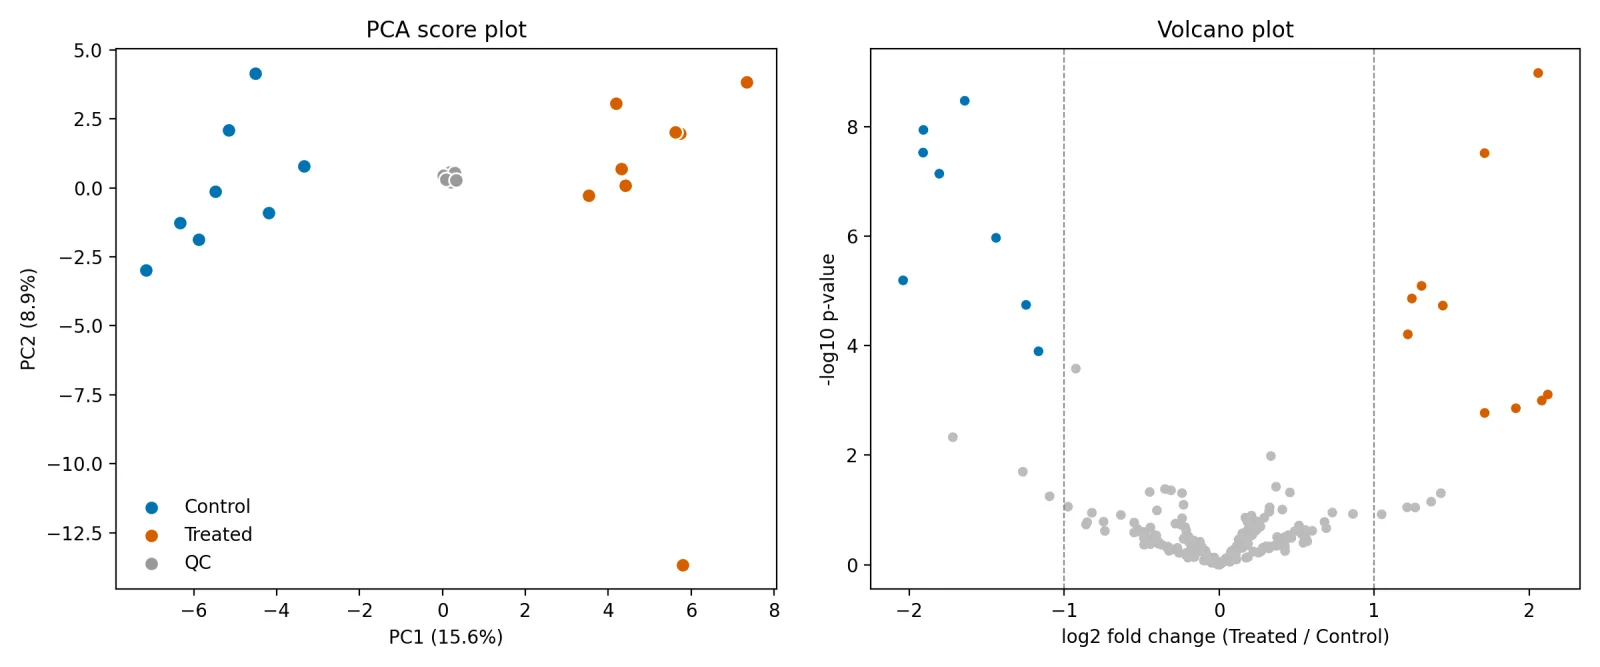
pca.png and volcano.png. Notice the one treated sample far below the others on PC2: in real data, check outliers like this before removing anything.- PCA first: check groups, outliers and QC clustering.
- Univariate tests on log data, always with FDR correction.
- Validate PLS-DA; never trust a pretty separation alone.
How are metabolites identified, and what are the confidence levels?
A feature is identified by combining accurate mass (usually within 5 ppm), isotope pattern, retention time and MS/MS fragmentation, matched against spectral libraries or predicted with in-silico tools. The Metabolomics Standards Initiative defines four confidence levels: level 1 identified with a pure reference standard on at least two properties, level 2 putatively annotated by a library match, level 3 assigned to a compound class, and level 4 unknown. Always report the level.
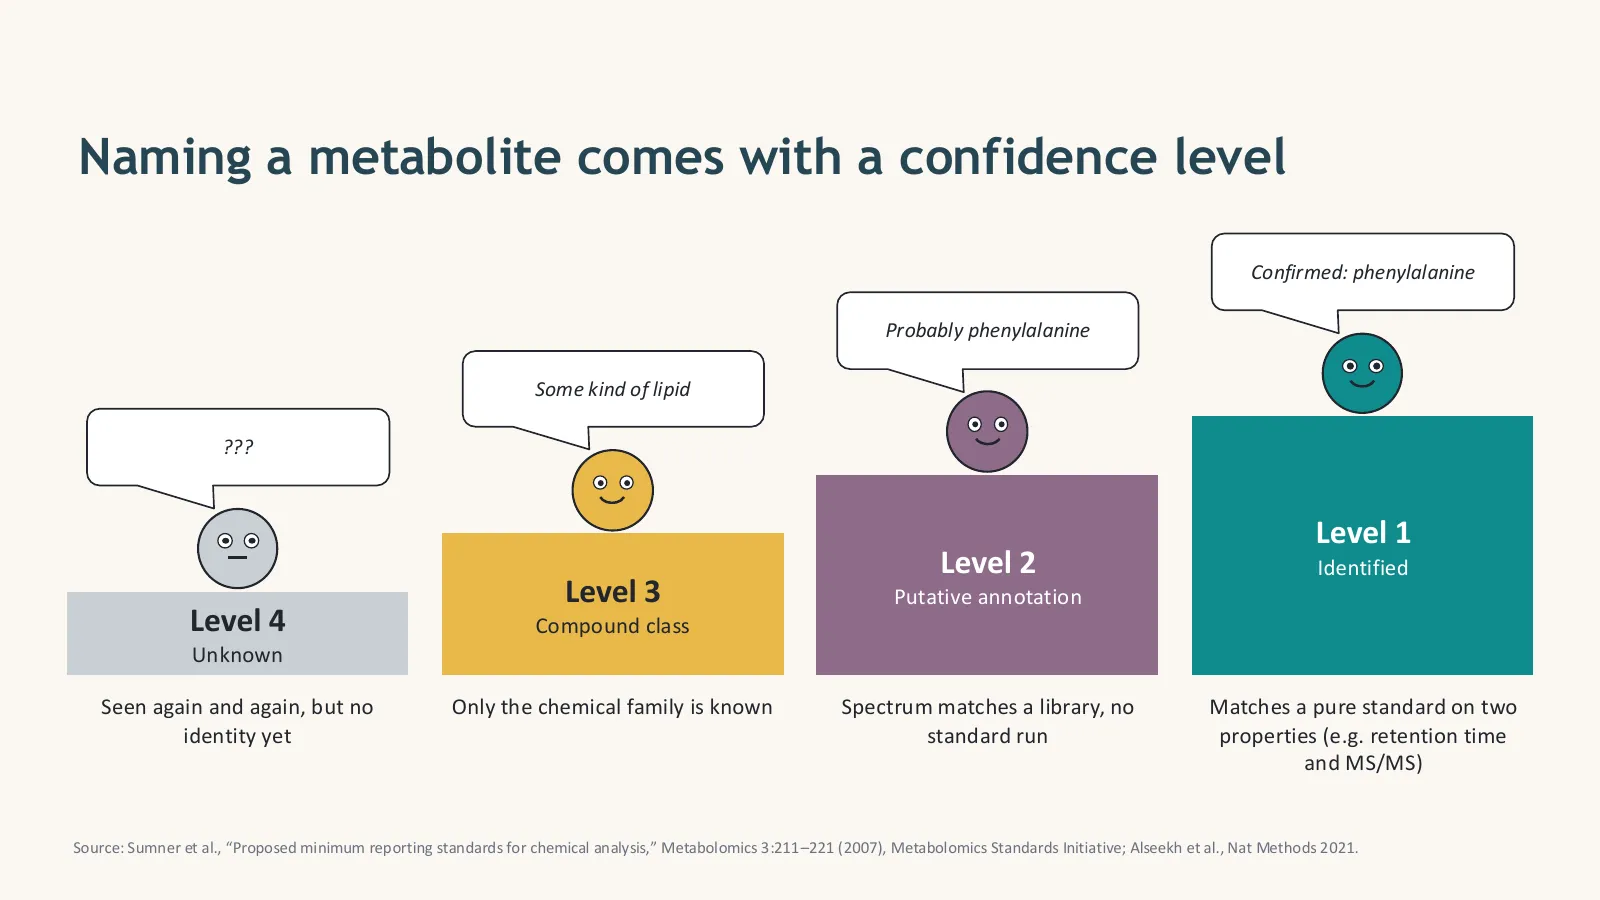
| Level | Name | Evidence needed |
|---|---|---|
| 1 | Identified | Matches a pure standard run on the same system on two or more properties (e.g. retention time and MS/MS) |
| 2 | Putatively annotated | Spectrum matches a library or the literature, without a standard |
| 3 | Compound class | Only the chemical family is known (e.g. “a phosphatidylcholine”) |
| 4 | Unknown | Seen reproducibly, but no identity yet |
For high-resolution MS, many labs also use the five-level scale of Schymanski et al. (2014), which splits putative structures into finer levels.
Databases and tools for annotation
- HMDB: human metabolites with masses, spectra and biology
- MassBank and MoNA: open MS/MS reference spectra
- GNPS: library search and molecular networking that groups related molecules by similar spectra
- SIRIUS with CSI:FingerID: predicts molecular formulas and structures from MS/MS, even for compounds not in libraries
- LIPID MAPS: lipid structures and classification
- PubChem and ChEBI: general chemical databases
- Mass + isotopes + retention time + MS/MS = identification evidence.
- Report the MSI level for every named metabolite.
- Confirm your key findings with standards.
How does pathway analysis turn changed metabolites into biology?
Pathway analysis maps changed metabolites onto known pathways in databases such as KEGG, Reactome and SMPDB, tests whether a pathway contains more changed metabolites than expected by chance (over-representation or enrichment analysis), and looks for where flow is blocked or rerouted. For untargeted data without confident identifications, mummichog-style methods test pathways directly from m/z features.
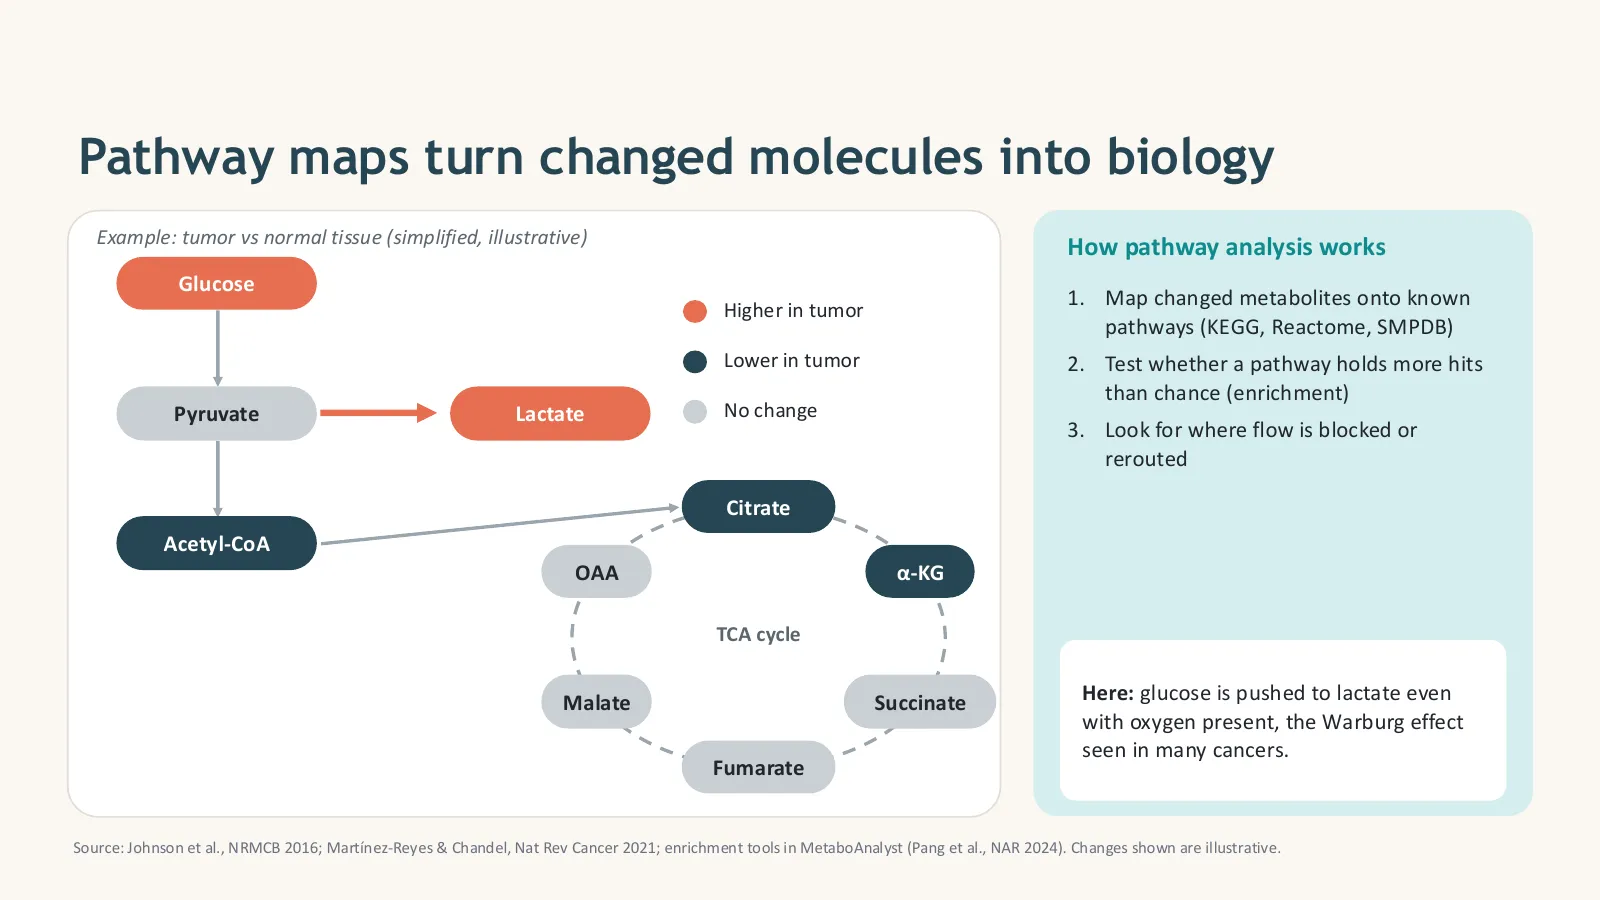
- Over-representation analysis (ORA): is the list of significant metabolites enriched in a pathway?
- Quantitative enrichment (MSEA): uses all measured values, not only a cut-off list
- Topology analysis: gives more weight to metabolites at important positions in a pathway
- mummichog / functional analysis: works from m/z features before identification (Li et al., 2013); available in MetaboAnalyst
- Map changes onto pathways, then test enrichment.
- Choose the right background set.
- Pathways generate hypotheses; experiments confirm them.
Where is metabolomics used in the real world?
Metabolomics is already used from hospitals to farms: newborn screening for inherited metabolic disorders, predicting type 2 diabetes and many other diseases from blood profiles, discovering oncometabolites in cancer, linking gut-microbe metabolites to heart disease, and guiding crop breeding for better flavour. It is also central to drug discovery, toxicology, nutrition and environmental research.
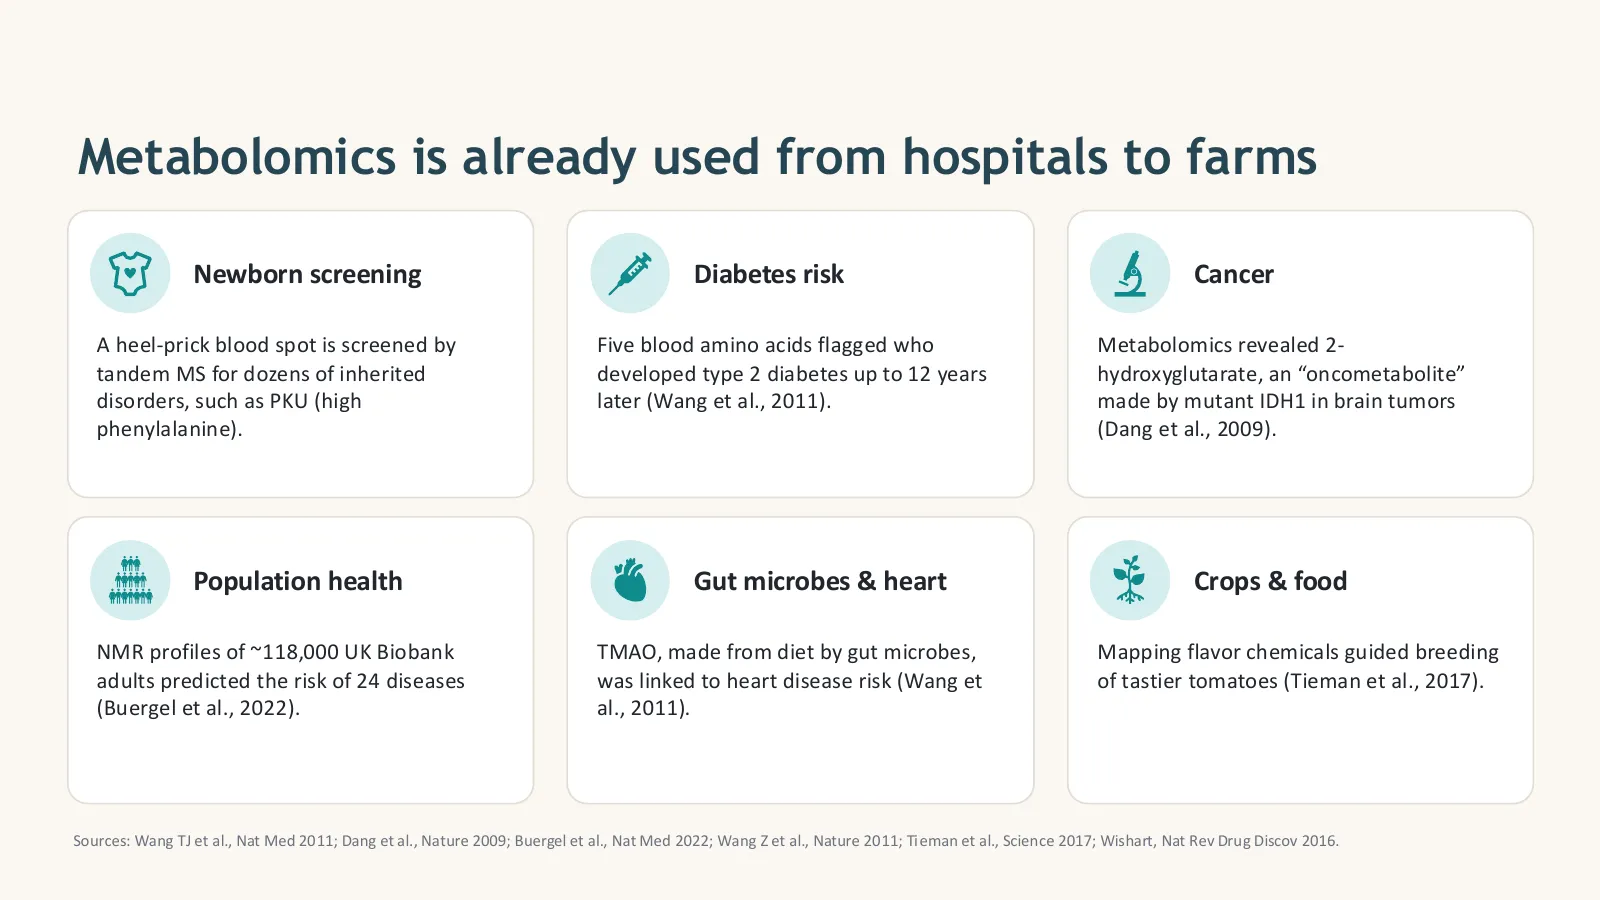
- Clinical use: newborn screening, risk prediction, cancer.
- Microbiome, nutrition, drugs and toxicology.
- Agriculture and food quality.
What are the biggest challenges and frontiers in metabolomics?
The biggest open problem is unknowns: most detected features still have no name. Other challenges are poor comparability between labs and instruments, metabolites that change within seconds of sampling, and telling cause from effect. The frontiers are single-cell and spatial metabolomics, population-scale studies of 100,000+ people, AI tools that predict structures from MS/MS spectra, and integration with genomics, transcriptomics and proteomics.
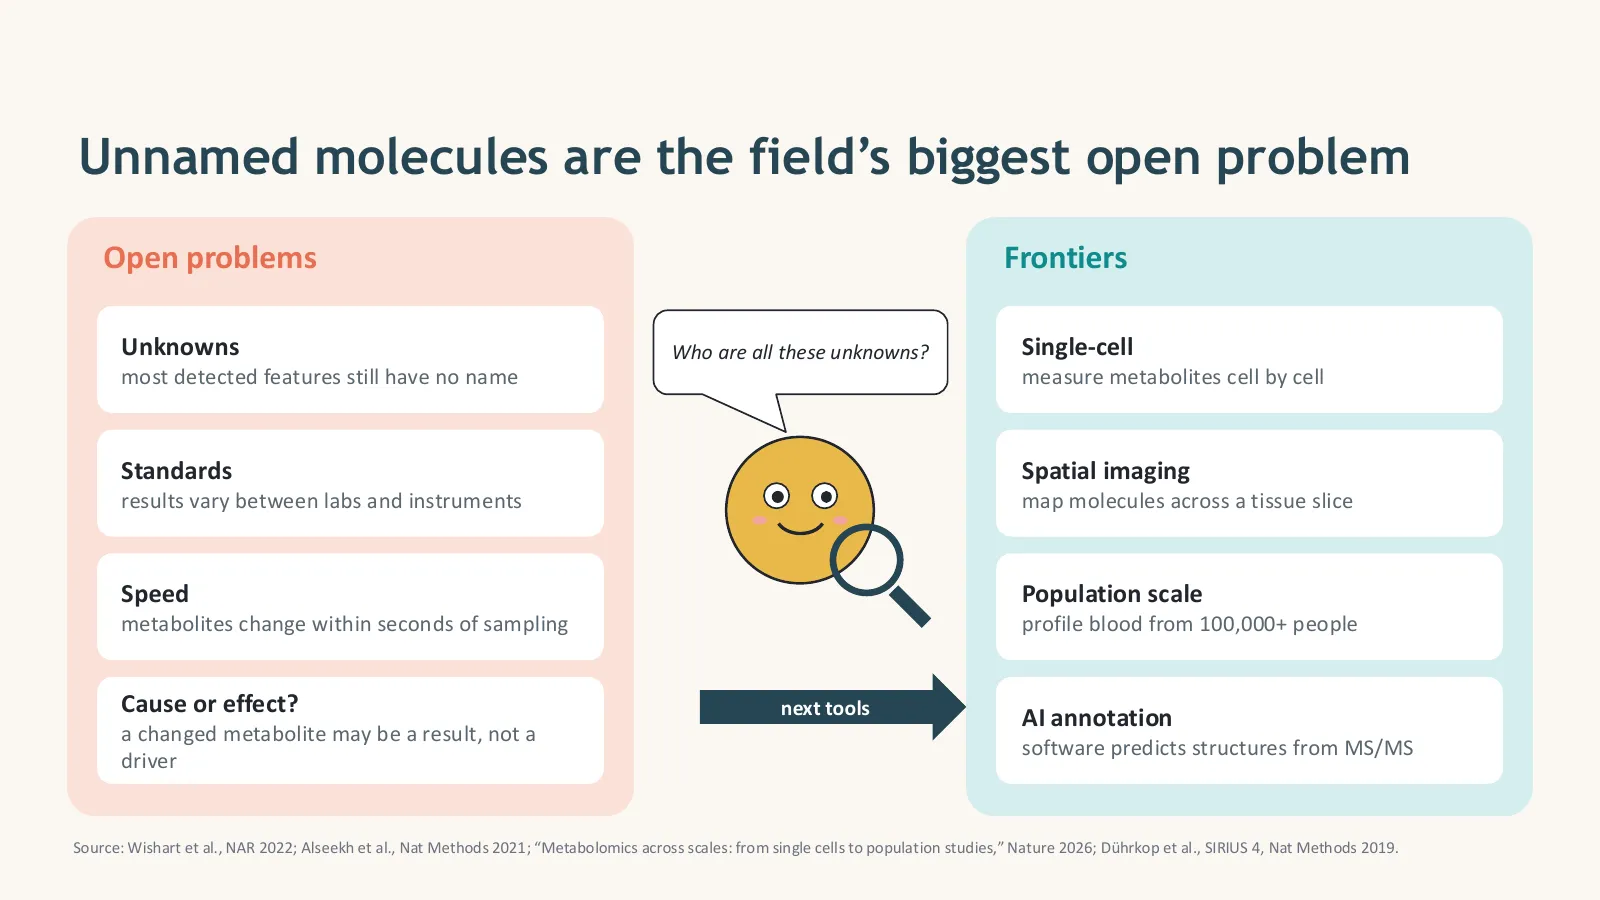
Multi-omics integration
Metabolomics becomes even more powerful when combined with other layers: a gene variant (genomics) that changes an enzyme’s expression (transcriptomics and proteomics) and so a metabolite level (metabolomics) tells a complete causal story. Methods include correlation networks, joint dimensionality reduction (for example MOFA or DIABLO in mixOmics) and pathway-level integration. For protein structures behind enzymes, see my AlphaFold tutorial.
Reporting and sharing your data
Good science is reproducible. Deposit raw data and metadata in MetaboLights or the Metabolomics Workbench, describe your QC procedures, and report identification levels. These repositories are also free sources of real datasets for practice.
- Unknowns are the field’s biggest problem.
- Single-cell, spatial, population-scale and AI annotation are the frontiers.
- Share raw data and report QC and identification levels.
How do you learn metabolomics data analysis, step by step?
Learn in layers: first biochemistry basics and the vocabulary (metabolite, feature, m/z, retention time), then how LC-MS, GC-MS and NMR work, then Python or R and statistics, then hands-on processing with MZmine or MS-DIAL and analysis with MetaboAnalyst on public datasets from MetaboLights or the Metabolomics Workbench. Finish with a small project you can put on GitHub and in your CV.
- Week 1: concepts. Read Sections 1–4 of this guide and watch episodes 1 and 2 of the video course.
- Week 2: instruments and workflow. Sections 5–6 and episode 3; read the primer by Liu & Locasale (2017).
- Week 3: programming and statistics. Run the Python scripts in Section 8; learn pandas, PCA and FDR.
- Week 4: real data. Download a small study from MetaboLights, process it with MZmine or MS-DIAL, and analyse it in MetaboAnalyst and Python.
- Week 5: annotation and pathways. Annotate top features with GNPS or SIRIUS, report MSI levels, run pathway analysis.
- Week 6: portfolio. Write up your project as a GitHub repository and a short report or poster.
Episode 2 is the best place to start building your vocabulary before you open any software:

- Step-by-step lessons for complete beginners
- Python, R and statistics for biological data
- Omics workflows, including metabolomics data analysis
- Projects for your CV, PhD and job applications
- Concepts → instruments → coding and statistics → real data → portfolio.
- Practise on public MetaboLights and Workbench datasets.
- A finished project on GitHub beats ten certificates.
The free Metabolomics Complete Course (Urdu/Hindi)
Key papers to read
Start here: reviews
- 1Liu & Locasale (2017) Metabolomics: a primerTrends in Biochemical Sciences 42:274–284
- 2Patti, Yanes & Siuzdak (2012) Metabolomics: the apogee of the omics trilogyNat Rev Mol Cell Biol 13:263–269
- 3Johnson, Ivanisevic & Siuzdak (2016) Metabolomics: beyond biomarkers and towards mechanismsNat Rev Mol Cell Biol 17:451–459
- 4Rinschen et al. (2019) Identification of bioactive metabolites using activity metabolomicsNat Rev Mol Cell Biol 20:353–367
- 5Wishart (2016) Emerging applications of metabolomics in drug discovery and precision medicineNat Rev Drug Discov 15:473–484
Methods, standards and databases
- 1
- 2Sumner et al. (2007) Proposed minimum reporting standards for chemical analysisMetabolomics 3:211–221
- 3Schymanski et al. (2014) Identifying small molecules via high resolution mass spectrometry: communicating confidenceEnviron Sci Technol 48:2097–2098
- 4Emwas et al. (2019) NMR spectroscopy for metabolomics researchMetabolites 9:123
- 5Wishart et al. (2022) HMDB 5.0: the Human Metabolome Database for 2022Nucleic Acids Research 50:D622–D631
- 6Pang et al. (2024) MetaboAnalyst 6.0Nucleic Acids Research 52:W398–W406
- 7Dührkop et al. (2019) SIRIUS 4: turning tandem mass spectra into metabolite structure informationNature Methods 16:299–302
- 8Li et al. (2013) Predicting network activity from high throughput metabolomics (mummichog)PLoS Comput Biol 9:e1003123
Free tools, databases and data repositories
- 1HMDBHuman Metabolome Database
- 2MetaboAnalystStatistics and pathway analysis online
- 3MZmineOpen-source LC-MS/GC-MS processing
- 4MS-DIALProcessing with built-in libraries
- 5XCMS (R)Peak picking and alignment in R
- 6GNPSSpectral libraries and molecular networking
- 7SIRIUSFormula and structure prediction from MS/MS
- 8MoNAMassBank of North America spectra
- 9KEGG PathwayMetabolic pathway maps
- 10LIPID MAPSLipid structures and tools
- 11MetaboLightsPublic metabolomics datasets (EMBL-EBI)
- 12Metabolomics WorkbenchPublic datasets and tools (NIH)
Related guides and courses on Codanics
- 1Bioinformatics ka ChillaThe complete bioinformatics course
- 2Why learning bioinformatics is essentialStart here if you are new
- 3AlphaFold tutorialProtein structure prediction
- 4Python ka Chilla for data science40 days of Python for analysis
- 5R with AammarR for statistics and figures
- 6Pandas mastery guideHandle feature tables in Python
- 7Data visualisation guideChoose the right plot
- 8ABC of statisticsStatistics from the basics
- 9Handling outliersSpot and treat outlier samples
- 10Systematic review and meta-analysisSynthesize published evidence
- 11Conference posters with AI toolsPresent your metabolomics results
- 12Using AI tools in scientific writingWrite up your study
More research, AI and bioinformatics guides on the Codanics blog.
Metabolomics glossary
- Metabolite
- A small molecule (usually below about 1,500 Da) that a cell makes, uses or takes in, such as glucose, lactate or an amino acid.
- Metabolome
- The complete set of metabolites in a biological sample at a given time.
- Metabolomics
- The large-scale measurement and study of metabolites in biological samples.
- Metabonomics
- An older, closely related term coined for NMR studies of metabolic responses in body fluids; today used almost interchangeably with metabolomics.
- Lipidomics
- A branch of metabolomics that focuses on lipids, such as fatty acids, phospholipids and cholesterol.
- Exposome
- Everything outside your genes that you are exposed to over a lifetime: food, drugs, microbes and pollutants.
- Xenobiotic
- A foreign chemical in the body, such as a drug, food additive or pollutant.
- Targeted metabolomics
- Measuring a predefined panel of known metabolites, usually with pure standards for exact amounts.
- Untargeted metabolomics
- Profiling as many signals as possible to discover differences, usually as relative amounts.
- Quenching
- Stopping metabolism immediately after sampling, for example with liquid nitrogen or cold solvent.
- Pooled QC
- A mixture of all study samples, injected throughout the run to monitor and correct instrument drift.
- Internal standard
- A known compound (often isotope-labelled) added to every sample to check recovery and correct signal variation.
- Blank
- A sample without biological material, used to detect contamination from tubes, solvents and the instrument.
- m/z
- Mass-to-charge ratio of an ion, the value a mass spectrometer measures.
- Adduct
- The ion form of a molecule, such as [M+H]+, [M+Na]+ or [M−H]−.
- Retention time
- When a compound comes out (elutes) of the chromatography column.
- ESI
- Electrospray ionization: a soft method that turns molecules in liquid into ions for LC-MS.
- MS/MS
- Tandem mass spectrometry: an ion is selected and broken into fragments whose masses help identify it.
- Feature
- A detected signal (one m/z at one retention time), not yet a confirmed metabolite.
- Feature table
- A matrix with samples in rows, features in columns and intensities in the cells.
- ppm error
- The difference between measured and theoretical mass in parts per million; high-resolution instruments reach below 5 ppm.
- PQN
- Probabilistic quotient normalization: corrects for samples that are more or less diluted.
- Pareto scaling
- Dividing each centred feature by the square root of its standard deviation, so large and small signals both contribute.
- PCA
- Principal component analysis: an unsupervised map of samples that shows groups, trends and outliers.
- PLS-DA
- Partial least squares discriminant analysis: a supervised model that separates known groups; it must be validated because it overfits easily.
- VIP score
- Variable importance in projection: ranks features by their contribution to a PLS-DA model.
- FDR
- False discovery rate: the expected share of false positives among significant results, controlled with the Benjamini–Hochberg method.
- Volcano plot
- A plot of fold change against statistical significance for every feature.
- Annotation
- Assigning a putative identity to a feature, with a stated confidence level.
- Pathway enrichment
- Testing whether a metabolic pathway contains more changed metabolites than expected by chance.
Frequently asked questions
What is metabolomics in simple words?
Metabolomics is the large-scale study of the small molecules (metabolites) in a cell, tissue, body fluid or organism, such as sugars, amino acids, lipids and organic acids. It shows the chemistry that is happening right now, so it is the omics layer closest to the phenotype.
What is the difference between a metabolite and the metabolome?
A metabolite is one small molecule, usually below about 1,500 Da, that a cell makes, uses or takes in. The metabolome is the complete set of metabolites in a sample at a given time.
What is the difference between targeted and untargeted metabolomics?
Targeted metabolomics measures a predefined list of known metabolites, usually tens to a few hundred, with exact amounts using pure standards; it tests a hypothesis. Untargeted metabolomics profiles thousands of signals, many unknown, as relative amounts; it discovers new hypotheses. Many labs discover with untargeted and confirm with targeted.
Which instruments are used in metabolomics?
Mostly mass spectrometry coupled to liquid chromatography (LC-MS) or gas chromatography (GC-MS), and nuclear magnetic resonance (NMR) spectroscopy. LC-MS detects the most metabolites, GC-MS is strong for small volatile or derivatized compounds, and NMR is highly reproducible, quantitative and non-destructive.
Is mass spectrometry or NMR better for metabolomics?
Neither is better for everything. Mass spectrometry is far more sensitive and detects hundreds to thousands of metabolites per run. NMR detects fewer (tens to about 100) but is very reproducible, quantifies directly and leaves the sample intact. Large studies often combine both.
What is a feature in metabolomics?
A feature is one detected signal defined by an m/z value and a retention time, with an intensity in each sample. It is not yet a named metabolite: one metabolite can give several features (adducts, isotopes, fragments), and many features stay unidentified.
What does m/z mean?
m/z is the mass-to-charge ratio of an ion. Most metabolite ions carry a single charge, so m/z is roughly the molecule's mass plus or minus a proton or another adduct. For example, glucose (180.063 Da) appears at m/z 179.056 as [M−H]− and at m/z 203.053 as [M+Na]+.
How are metabolites identified?
By matching accurate mass, isotope pattern, retention time and MS/MS fragmentation spectra against databases such as HMDB, MassBank, MoNA, GNPS and METLIN, or with in-silico tools such as SIRIUS. Confirmed identification (level 1) requires matching a pure reference standard on at least two properties.
What are the metabolite identification confidence levels?
The Metabolomics Standards Initiative defines four levels: level 1 identified (matches a pure standard), level 2 putatively annotated (matches a library spectrum), level 3 compound class, and level 4 unknown. Always report the level for every named metabolite.
Which software is used for metabolomics data analysis?
Free tools include MZmine, MS-DIAL and XCMS for processing raw LC-MS data, MetaboAnalyst for statistics and pathway analysis, GNPS for molecular networking and SIRIUS for structure annotation. Python and R are used for custom pipelines.
Can I learn metabolomics data analysis without a wet lab?
Yes. Public datasets from MetaboLights and the Metabolomics Workbench let you practise processing, statistics, annotation and pathway analysis with only a computer. Basic chemistry, statistics and Python or R are the key skills.
How many samples do I need for a metabolomics study?
It depends on the effect size and variability, but biological replicates in every group are essential, not just repeat injections of one sample. Pilot data or a power analysis help; many discovery studies use at least 6–10 biological replicates per group, and clinical studies far more.
What is a pooled QC sample?
A pooled QC is made by mixing a small amount of every study sample. It is injected regularly through the run to track instrument drift, filter unreliable features (for example RSD above 30%) and correct batch effects.
What is the Human Metabolome Database (HMDB)?
HMDB is a free online database of human metabolites with masses, spectra, concentrations and biological information. Version 5.0 (2022) contains about 218,000 metabolite entries, up from 2,180 in 2007.
Where can I learn metabolomics in Urdu or Hindi?
Watch the free Codanics Metabolomics Complete Course playlist on YouTube and join the Bioinformatics ka Chilla course on codanics.com for a structured, practical path through bioinformatics, including omics data analysis.
No questions match. Try another word.
About the author. Dr. Muhammad Aammar Tufail is the founder of Codanics and completed his PhD in a Marie Skłodowska-Curie programme. He teaches bioinformatics, data science, AI tools for research and scientific writing in Urdu and Hindi.
Follow him on Facebook, Instagram, TikTok and LinkedIn, see his code on GitHub and Kaggle, and his research on Google Scholar and ResearchGate.
The Python scripts were tested on 8 November 2026 with Python 3.13. The example dataset is simulated for teaching. Masses are monoisotopic values from HMDB; the slides use simplified, illustrative data where noted. Software features change, so check each tool’s latest documentation.
